
- Startseite >
- Flüsse >
- Wasserstand >
- Bayern >
- Obermühlhausen >
- Jahresgrafik

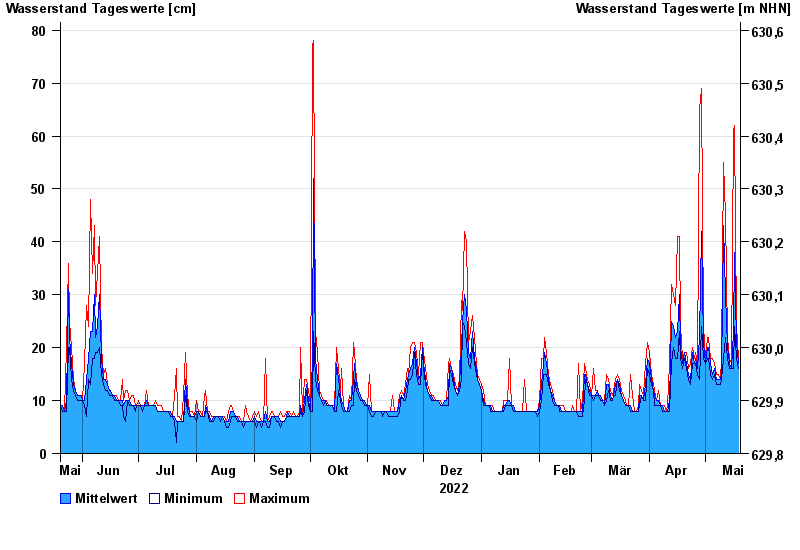
Jahresgrafik Obermühlhausen / Beurerbach
Wasserstand vom 20.05.2022 bis zum 19.05.2023
- 29.05.2007 Wasserstand: 118 cm
- 30.06.2011 Wasserstand: 115 cm
- 02.06.2013 Wasserstand: 111 cm
- 03.06.2010 Wasserstand: 104 cm
- 23.08.2005 Wasserstand: 103 cm
| Datum | Mittelwert [cm] | Maximum [cm] | Minimum [cm] |
|---|---|---|---|
| 19.05.2023 | 17 | 18 | 16 |
| 18.05.2023 | 21 | 24 | 18 |
| 17.05.2023 | 38 | 62 | 24 |
| 16.05.2023 | 23 | 61 | 16 |
| 15.05.2023 | 16 | 17 | 16 |
| 14.05.2023 | 17 | 18 | 16 |
| 13.05.2023 | 20 | 22 | 18 |
© Bayerisches Landesamt für Umwelt 2024