
- Startseite >
- Flüsse >
- Wasserstand >
- Bayern >
- Neumarkt Kanalhafen >
- Jahresgrafik

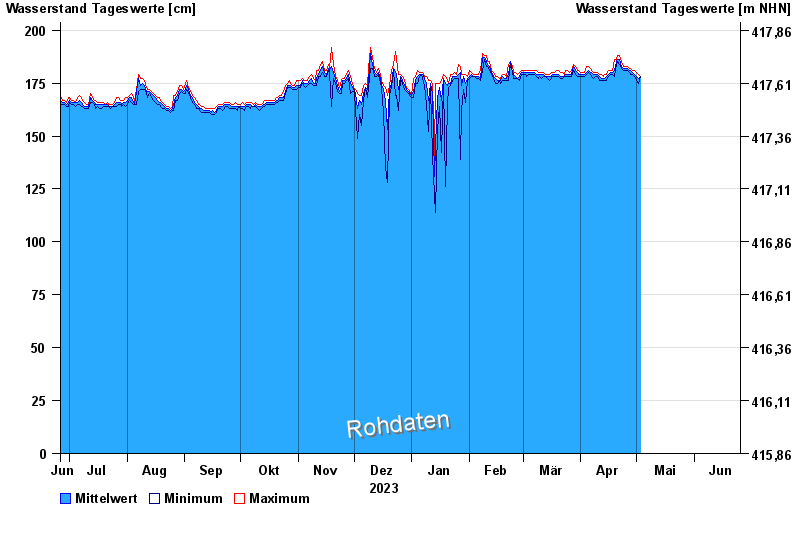
Jahresgrafik Neumarkt Kanalhafen / LDM-Kanal
Wasserstand vom 26.06.2023 bis zum 25.06.2024
 Für diesen Pegel sind keine Meldestufen hinterlegt.
| Datum | Mittelwert [cm] | Maximum [cm] | Minimum [cm] |
|---|---|---|---|
| 19.05.2024 | 180 | 181 | 179 |
| 18.05.2024 | 181 | 183 | 178 |
| 17.05.2024 | 177 | 180 | 175 |
| 16.05.2024 | 175 | 176 | 174 |
| 15.05.2024 | 175 | 177 | 173 |
| 14.05.2024 | 175 | 177 | 174 |
| 13.05.2024 | 176 | 178 | 175 |
© Bayerisches Landesamt für Umwelt 2024