
- Startseite >
- Flüsse >
- Wasserstand >
- Bayern >
- Neumarkt Kanalhafen >
- Jahresgrafik

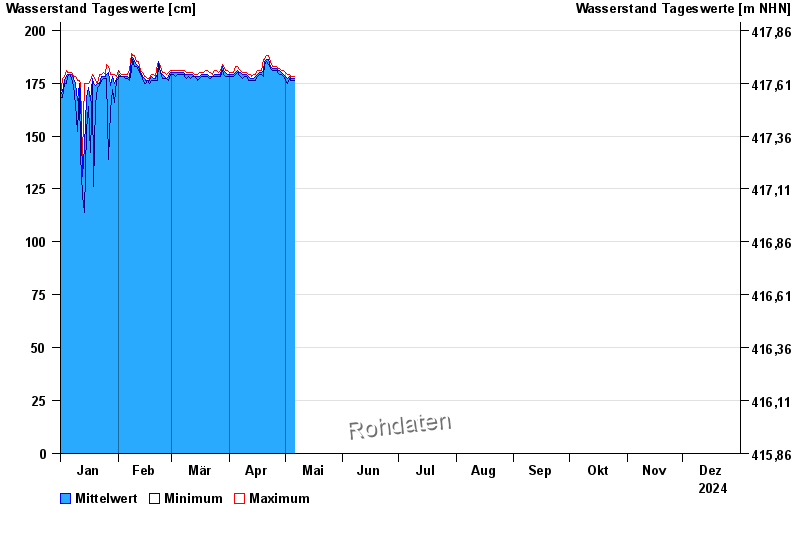
Jahresgrafik Neumarkt Kanalhafen / LDM-Kanal
Wasserstand vom 01.01.2024 bis zum 31.12.2024
 Für diesen Pegel sind keine historische Ereignisse hinterlegt.
| Datum | Mittelwert [cm] | Maximum [cm] | Minimum [cm] |
|---|---|---|---|
| 05.06.2024 | 178 | 179 | 178 |
| 04.06.2024 | 182 | 186 | 179 |
| 03.06.2024 | 190 | 195 | 185 |
| 02.06.2024 | 192 | 199 | 170 |
| 01.06.2024 | 189 | 198 | 172 |
| 31.05.2024 | 182 | 188 | 179 |
| 30.05.2024 | 181 | 182 | 180 |
© Bayerisches Landesamt für Umwelt 2024