
- Startseite >
- Flüsse >
- Wasserstand >
- Bayern >
- Neudorf >
- Jahresgrafik

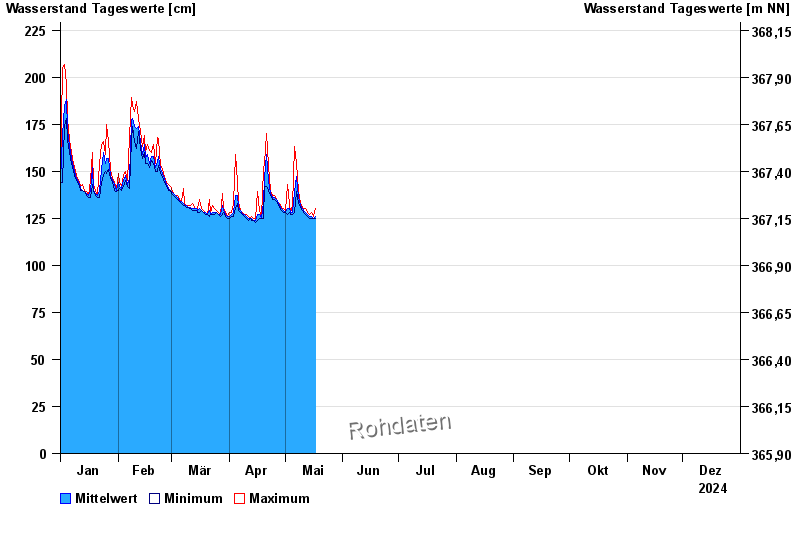
Jahresgrafik Neudorf / Kronach
Wasserstand vom 01.01.2024 bis zum 31.12.2024
 Für diesen Pegel sind keine Hochwassermarken hinterlegt.
| Datum | Mittelwert [cm] | Maximum [cm] | Minimum [cm] |
|---|---|---|---|
| 23.05.2024 | 143 | 146 | 141 |
| 22.05.2024 | 161 | 176 | 146 |
| 21.05.2024 | 132 | 180 | 124 |
| 20.05.2024 | 126 | 127 | 124 |
| 19.05.2024 | 128 | 132 | 126 |
| 18.05.2024 | 127 | 129 | 126 |
| 17.05.2024 | 126 | 129 | 125 |
© Bayerisches Landesamt für Umwelt 2024