
- Startseite >
- Flüsse >
- Wasserstand >
- Bayern >
- Neuburg >
- Jahresgrafik

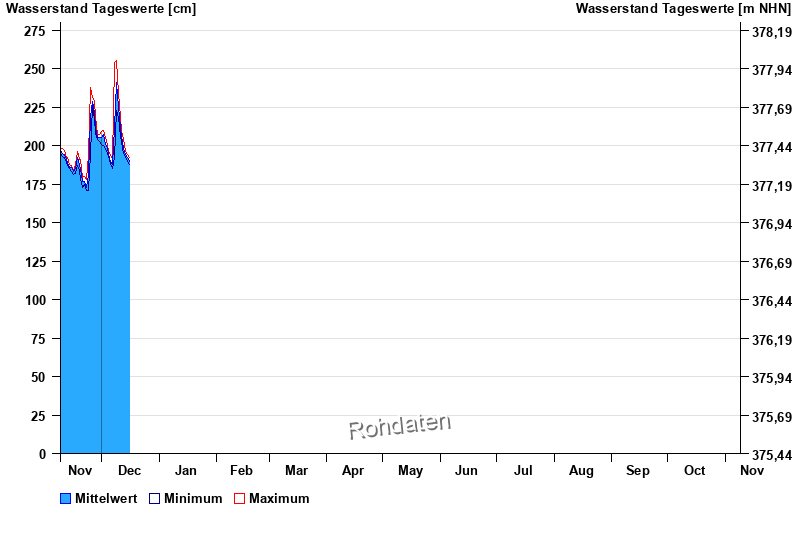
Jahresgrafik Neuburg / Donau
Wasserstand vom 09.11.2025 bis zum 08.11.2026
- 23.05.1999 Wasserstand: 734 cm
- 25.08.2005 Wasserstand: 662 cm
- 13.08.2002 Wasserstand: 603 cm
- 03.06.2013 Wasserstand: 596 cm
- 14.05.1999 Wasserstand: 588 cm
| Datum | Mittelwert [cm] | Maximum [cm] | Minimum [cm] |
|---|---|---|---|
| 16.12.2025 | 191 | 192 | 190 |
| 15.12.2025 | 192 | 194 | 190 |
| 14.12.2025 | 194 | 196 | 192 |
| 13.12.2025 | 198 | 204 | 195 |
| 12.12.2025 | 206 | 209 | 202 |
| 11.12.2025 | 212 | 219 | 206 |
| 10.12.2025 | 225 | 234 | 218 |
© Bayerisches Landesamt für Umwelt 2025