
- Startseite >
- Flüsse >
- Wasserstand >
- Bayern >
- Laubendorf >
- Jahresgrafik

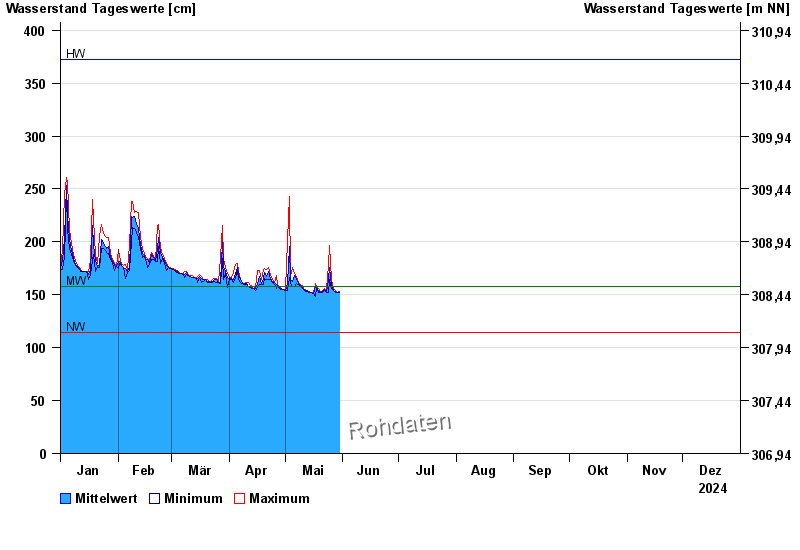
Jahresgrafik Laubendorf / Zenn
Wasserstand vom 01.01.2024 bis zum 31.12.2024
| Datum | Mittelwert [cm] | Maximum [cm] | Minimum [cm] |
|---|---|---|---|
| 14.05.2024 | 152 | 153 | 152 |
| 13.05.2024 | 154 | 154 | 153 |
| 12.05.2024 | 154 | 155 | 153 |
| 11.05.2024 | 156 | 156 | 155 |
| 10.05.2024 | 157 | 159 | 156 |
| 09.05.2024 | 159 | 160 | 159 |
| 08.05.2024 | 161 | 162 | 160 |
© Bayerisches Landesamt für Umwelt 2024