
- Startseite >
- Flüsse >
- Wasserstand >
- Bayern >
- Langenbruck >
- Jahresgrafik

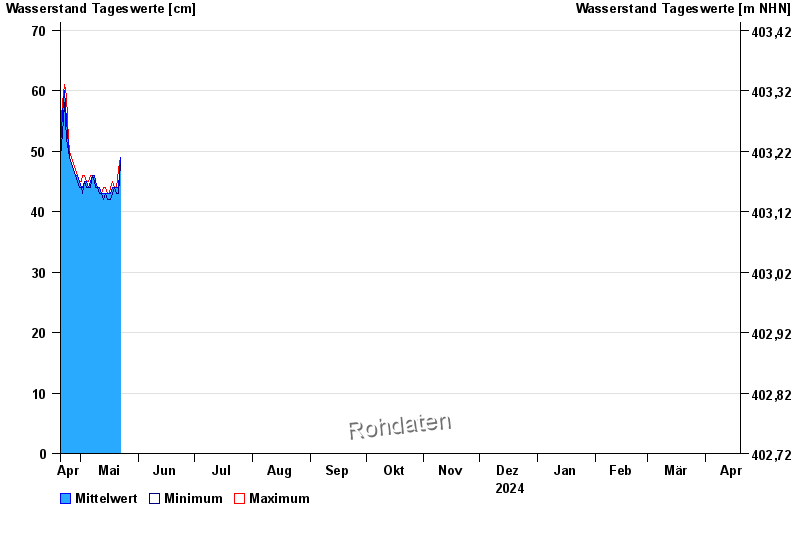
Jahresgrafik Langenbruck / Frankenohe
Wasserstand vom 20.04.2024 bis zum 19.04.2025
| Datum | Mittelwert [cm] | Maximum [cm] | Minimum [cm] |
|---|---|---|---|
| 07.06.2024 | 46 | 46 | 46 |
| 06.06.2024 | 46 | 47 | 46 |
| 05.06.2024 | 47 | 48 | 46 |
| 04.06.2024 | 49 | 50 | 48 |
| 03.06.2024 | 53 | 57 | 50 |
| 02.06.2024 | 65 | 73 | 57 |
| 01.06.2024 | 53 | 74 | 48 |
© Bayerisches Landesamt für Umwelt 2024