
- Startseite >
- Flüsse >
- Wasserstand >
- Bayern >
- Illesheim >
- Jahresgrafik

Jahresgrafik Illesheim / Aisch
Wasserstand vom 28.04.2024 bis zum 27.04.2025
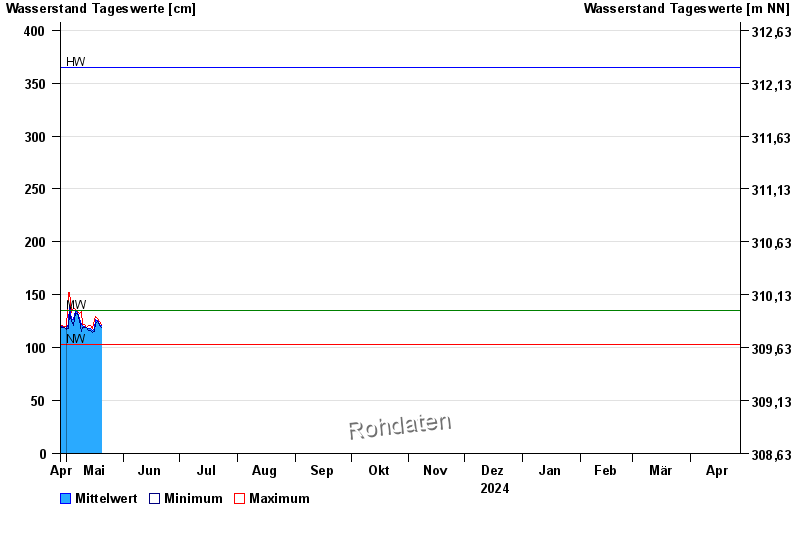
Hinweis
Wasserstand und Abfluss wird zeitweise durch Biberdamm beeinflusst.
| Datum | Mittelwert [cm] | Maximum [cm] | Minimum [cm] |
|---|---|---|---|
| 20.05.2024 | 120 | 122 | 118 |
| 19.05.2024 | 122 | 125 | 121 |
| 18.05.2024 | 126 | 128 | 125 |
| 17.05.2024 | 127 | 129 | 123 |
| 16.05.2024 | 118 | 126 | 115 |
| 15.05.2024 | 116 | 118 | 114 |
| 14.05.2024 | 118 | 121 | 116 |
© Bayerisches Landesamt für Umwelt 2024