
- Startseite >
- Flüsse >
- Wasserstand >
- Bayern >
- Hoflach >
- Jahresgrafik

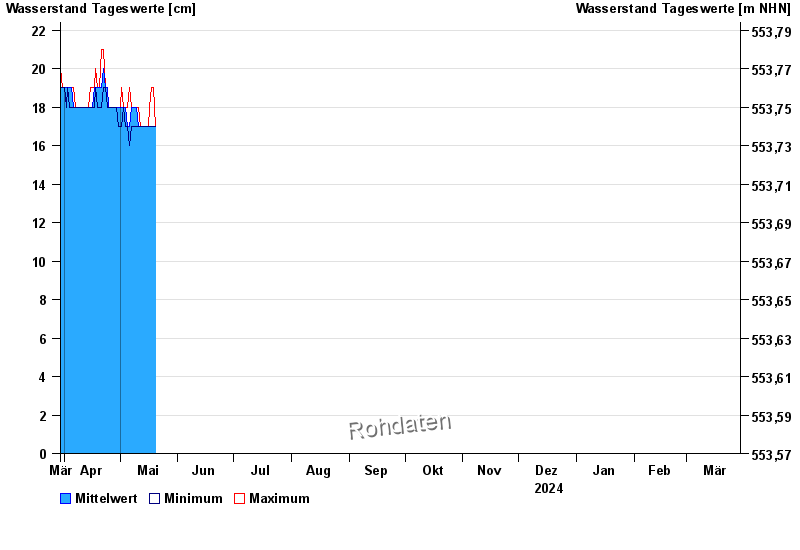
Jahresgrafik Hoflach / Birkenmoosgraben
Wasserstand vom 30.03.2024 bis zum 29.03.2025
 Für diesen Pegel sind keine historische Ereignisse hinterlegt.
| Datum | Mittelwert [cm] | Maximum [cm] | Minimum [cm] |
|---|---|---|---|
| 03.06.2024 | 32 | 33 | 31 |
| 02.06.2024 | 50 | 116 | 33 |
| 01.06.2024 | 103 | 152 | 38 |
| 31.05.2024 | 30 | 41 | 20 |
| 30.05.2024 | 20 | 22 | 18 |
| 29.05.2024 | 18 | 19 | 18 |
| 28.05.2024 | 20 | 22 | 19 |
© Bayerisches Landesamt für Umwelt 2024