
- Startseite >
- Flüsse >
- Wasserstand >
- Bayern >
- Hörmanshofen >
- Jahresgrafik

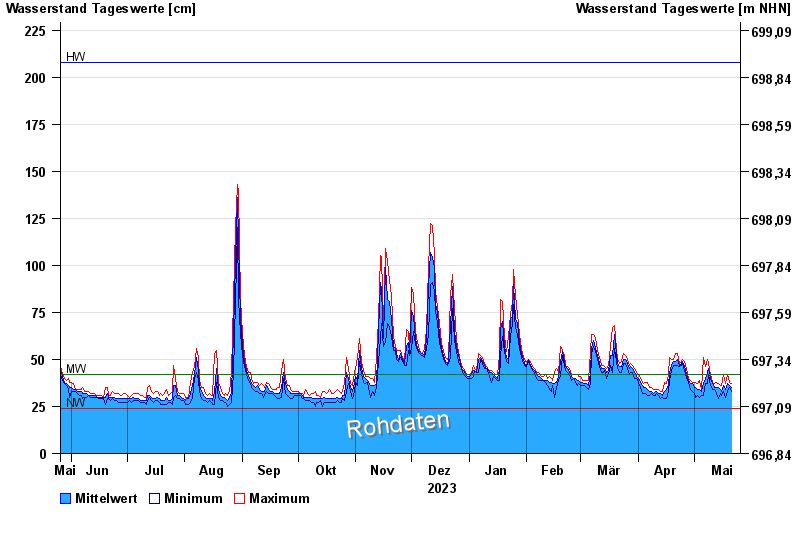
Jahresgrafik Hörmanshofen / Geltnach
Wasserstand vom 26.05.2023 bis zum 25.05.2024
| Datum | Mittelwert [cm] | Maximum [cm] | Minimum [cm] |
|---|---|---|---|
| 07.05.2024 | 42 | 46 | 41 |
| 06.05.2024 | 37 | 51 | 31 |
| 05.05.2024 | 33 | 34 | 31 |
| 04.05.2024 | 34 | 39 | 30 |
| 03.05.2024 | 34 | 37 | 31 |
| 02.05.2024 | 35 | 38 | 30 |
| 01.05.2024 | 35 | 38 | 32 |
© Bayerisches Landesamt für Umwelt 2024