
- Startseite >
- Flüsse >
- Wasserstand >
- Bayern >
- Hörmanshofen >
- Jahresgrafik

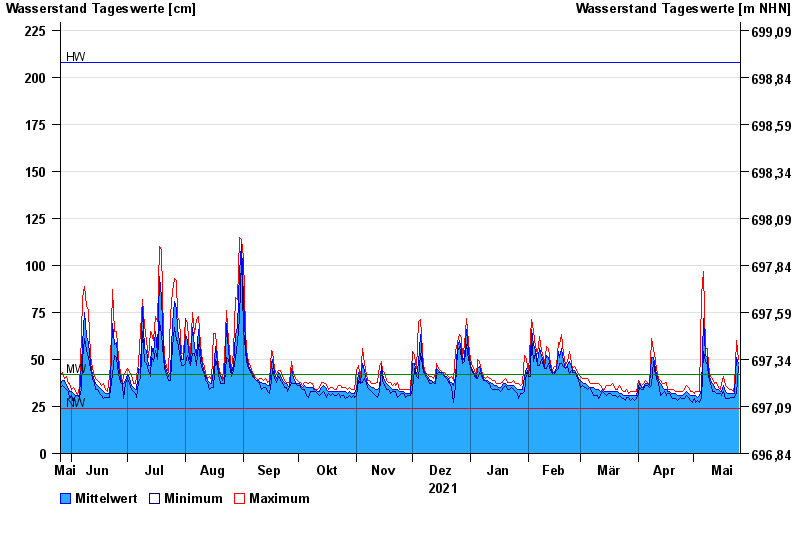
Jahresgrafik Hörmanshofen / Geltnach
Wasserstand vom 26.05.2021 bis zum 25.05.2022
| Datum | Mittelwert [cm] | Maximum [cm] | Minimum [cm] |
|---|---|---|---|
| 25.05.2022 | 48 | 50 | 46 |
| 24.05.2022 | 51 | 60 | 32 |
| 23.05.2022 | 32 | 36 | 30 |
| 22.05.2022 | 32 | 33 | 30 |
| 21.05.2022 | 32 | 34 | 30 |
| 20.05.2022 | 32 | 34 | 29 |
| 19.05.2022 | 32 | 35 | 29 |
© Bayerisches Landesamt für Umwelt 2024