
- Startseite >
- Flüsse >
- Wasserstand >
- Bayern >
- Hechendorf >
- Jahresgrafik

Jahresgrafik Hechendorf / Ramsach
Wasserstand vom 23.09.2021 bis zum 22.09.2022
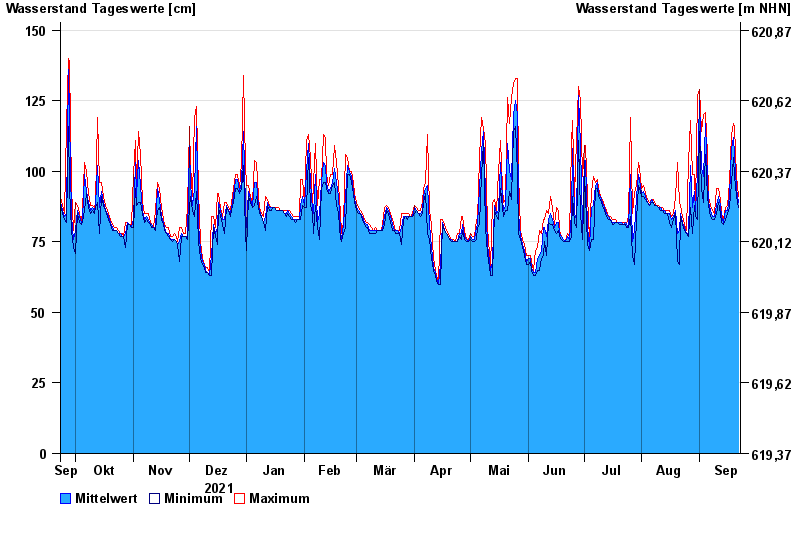
Hinweis
Messwerte beeinflusst durch Kraftwerkssteuerungen.
| Datum | Mittelwert [cm] | Maximum [cm] | Minimum [cm] |
|---|---|---|---|
| 22.09.2022 | 89 | 91 | 87 |
| 21.09.2022 | 94 | 98 | 91 |
| 20.09.2022 | 106 | 116 | 98 |
| 19.09.2022 | 112 | 117 | 105 |
| 18.09.2022 | 108 | 113 | 96 |
| 17.09.2022 | 91 | 96 | 87 |
| 16.09.2022 | 86 | 88 | 85 |
© Bayerisches Landesamt für Umwelt 2024