
- Startseite >
- Flüsse >
- Wasserstand >
- Bayern >
- Hallerndorf >
- Jahresgrafik

Jahresgrafik Hallerndorf / Aisch
Wasserstand vom 01.01.2024 bis zum 04.05.2024
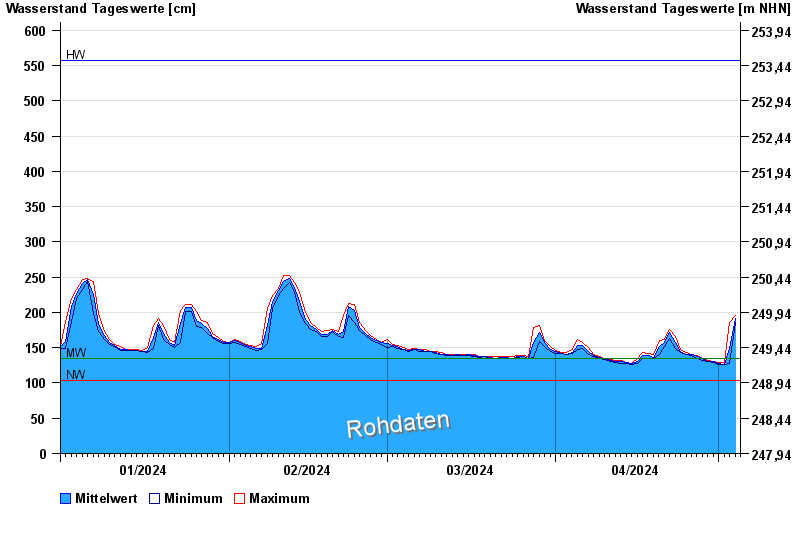
| Datum | Mittelwert [cm] | Maximum [cm] | Minimum [cm] |
|---|---|---|---|
| 04.05.2024 | 191 | 195 | 186 |
| 03.05.2024 | 149 | 186 | 127 |
| 02.05.2024 | 126 | 129 | 126 |
| 01.05.2024 | 128 | 129 | 126 |
| 30.04.2024 | 130 | 131 | 129 |
| 29.04.2024 | 131 | 132 | 130 |
| 28.04.2024 | 134 | 135 | 132 |
© Bayerisches Landesamt für Umwelt 2024