
- Startseite >
- Flüsse >
- Wasserstand >
- Bayern >
- Gräfendorf >
- Jahresgrafik

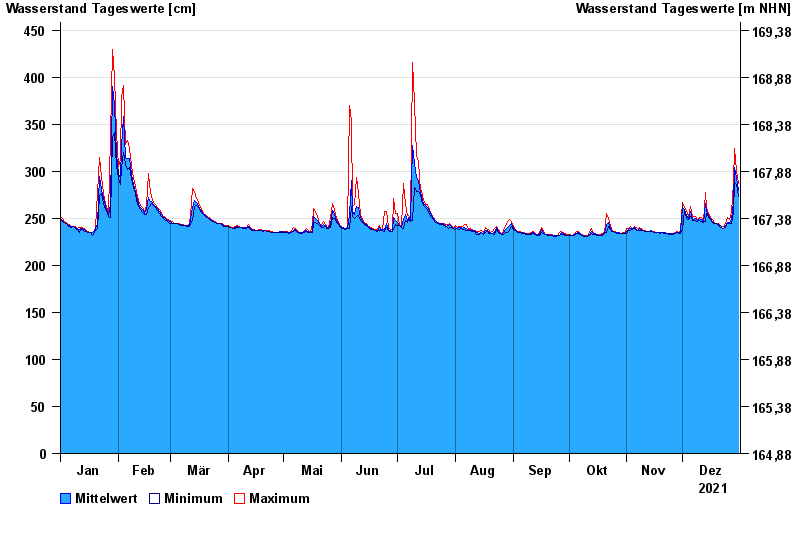
Jahresgrafik Gräfendorf / Schondra
Wasserstand vom 01.01.2021 bis zum 31.12.2021
 Für diesen Pegel sind keine Hochwassermarken hinterlegt.
| Datum | Mittelwert [cm] | Maximum [cm] | Minimum [cm] |
|---|---|---|---|
| 31.12.2021 | 280 | 287 | 273 |
| 30.12.2021 | 293 | 301 | 286 |
| 29.12.2021 | 304 | 324 | 288 |
| 28.12.2021 | 268 | 288 | 256 |
| 27.12.2021 | 249 | 256 | 244 |
| 26.12.2021 | 246 | 249 | 244 |
| 25.12.2021 | 246 | 251 | 244 |
© Bayerisches Landesamt für Umwelt 2025