
- Startseite >
- Flüsse >
- Wasserstand >
- Bayern >
- Goldbach >
- Jahresgrafik

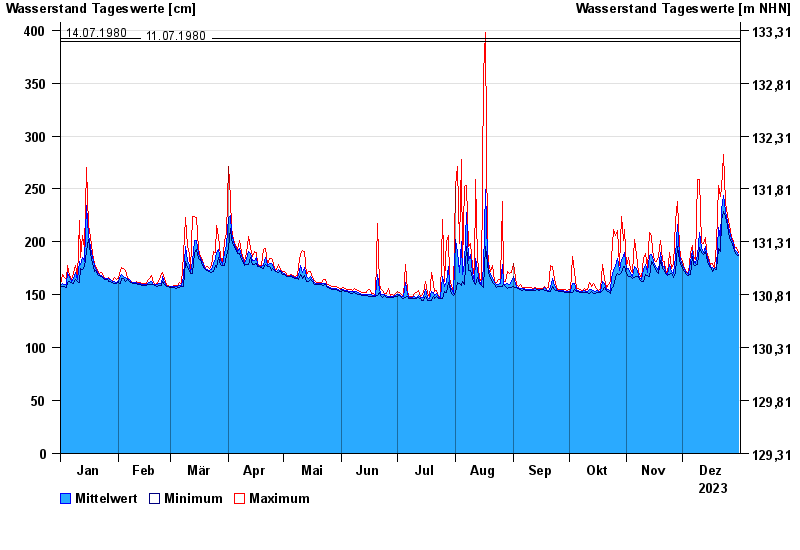
Jahresgrafik Goldbach / Aschaff
Wasserstand vom 01.01.2023 bis zum 31.12.2023
- 10.08.1981 Wasserstand: 462 cm
- 28.10.1998 Wasserstand: 426 cm
- 26.01.1995 Wasserstand: 407 cm
- 14.07.1980 Wasserstand: 392 cm
- 11.07.1980 Wasserstand: 389 cm
| Datum | Mittelwert [cm] | Maximum [cm] | Minimum [cm] |
|---|---|---|---|
| 31.12.2023 | 188 | 190 | 187 |
| 30.12.2023 | 191 | 195 | 188 |
| 29.12.2023 | 193 | 195 | 191 |
| 28.12.2023 | 198 | 200 | 195 |
| 27.12.2023 | 202 | 205 | 200 |
| 26.12.2023 | 210 | 215 | 203 |
| 25.12.2023 | 219 | 225 | 215 |
© Bayerisches Landesamt für Umwelt 2024