
- Startseite >
- Flüsse >
- Wasserstand >
- Bayern >
- Garmisch u. d. Partnachmündung >
- Jahresgrafik

Jahresgrafik Garmisch u. d. Partnachmündung / Loisach
Wasserstand vom 28.04.2024 bis zum 27.04.2025
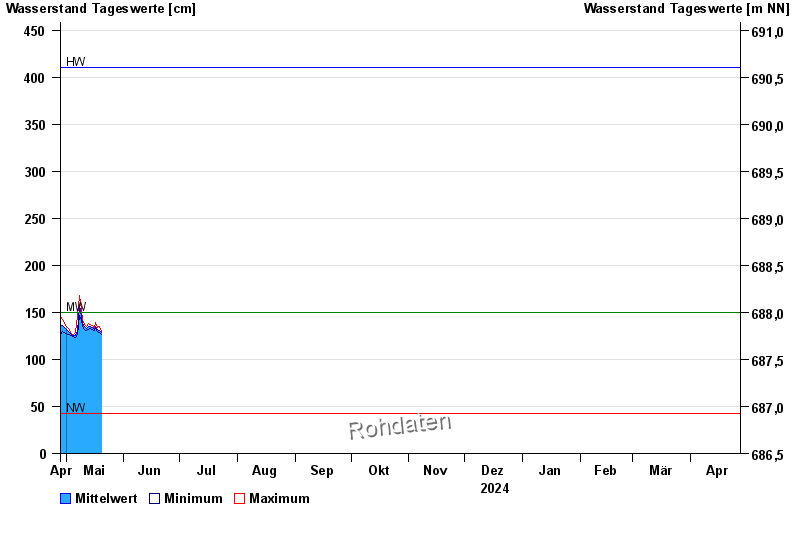
Hinweis
Messwerte beeinflusst durch Kraftwerkssteuerungen.
| Datum | Mittelwert [cm] | Maximum [cm] | Minimum [cm] |
|---|---|---|---|
| 02.06.2024 | 199 | 207 | 191 |
| 01.06.2024 | 219 | 234 | 190 |
| 31.05.2024 | 174 | 198 | 149 |
| 30.05.2024 | 147 | 151 | 139 |
| 29.05.2024 | 145 | 152 | 141 |
| 28.05.2024 | 163 | 177 | 152 |
| 27.05.2024 | 134 | 170 | 125 |
© Bayerisches Landesamt für Umwelt 2024