
- Startseite >
- Flüsse >
- Wasserstand >
- Bayern >
- Gaden >
- Jahresgrafik

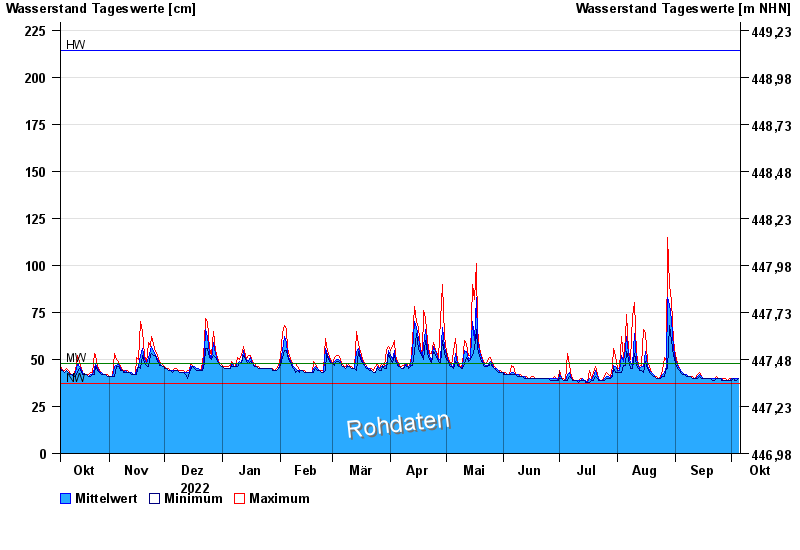
Jahresgrafik Gaden / Schinderbach
Wasserstand vom 06.10.2022 bis zum 05.10.2023
Hinweis
Datenabruf nur 07:00, 15:00 und 23:00 MEZ
| Datum | Mittelwert [cm] | Maximum [cm] | Minimum [cm] |
|---|---|---|---|
| 05.10.2023 | 40 | 40 | 40 |
| 04.10.2023 | 40 | 40 | 39 |
| 03.10.2023 | 40 | 40 | 39 |
| 02.10.2023 | 40 | 40 | 40 |
| 01.10.2023 | 40 | 40 | 39 |
| 30.09.2023 | 39 | 40 | 39 |
| 29.09.2023 | 39 | 39 | 39 |
© Bayerisches Landesamt für Umwelt 2024