
- Startseite >
- Flüsse >
- Wasserstand >
- Bayern >
- Füssen >
- Jahresgrafik

Jahresgrafik Füssen / Lech
Wasserstand vom 27.10.2021 bis zum 26.10.2022
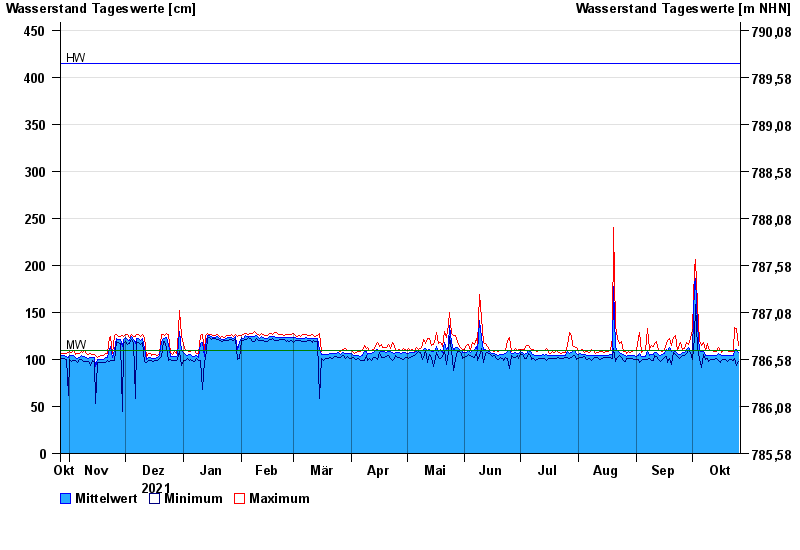
| Datum | Mittelwert [cm] | Maximum [cm] | Minimum [cm] |
|---|---|---|---|
| 26.10.2022 | 107 | 115 | 98 |
| 25.10.2022 | 111 | 133 | 94 |
| 24.10.2022 | 109 | 134 | 101 |
| 23.10.2022 | 104 | 108 | 99 |
| 22.10.2022 | 104 | 108 | 100 |
| 21.10.2022 | 104 | 108 | 100 |
| 20.10.2022 | 104 | 110 | 98 |
© Bayerisches Landesamt für Umwelt 2024