
- Startseite >
- Flüsse >
- Wasserstand >
- Bayern >
- Fischach >
- Jahresgrafik

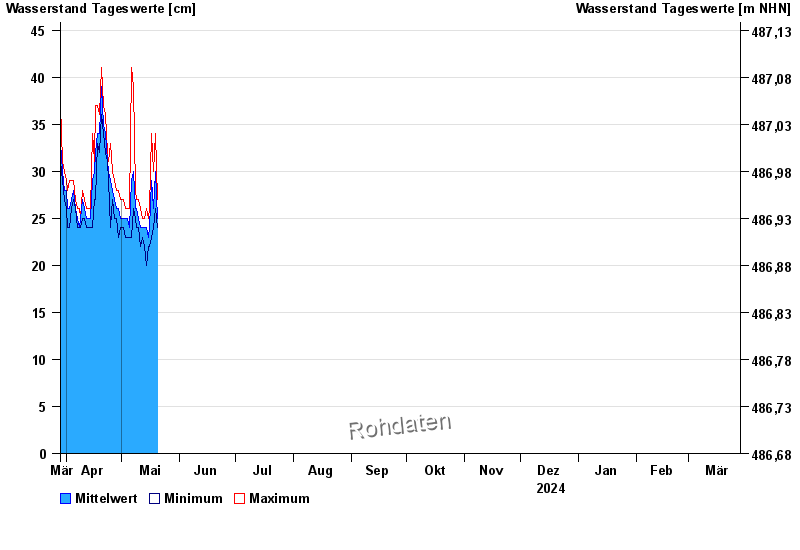
Jahresgrafik Fischach / Schmutter
Wasserstand vom 29.03.2024 bis zum 28.03.2025
- 22.08.2005 Wasserstand: 316 cm
- 31.07.1977 Wasserstand: 297 cm
- 29.09.1981 Wasserstand: 270 cm
- 12.08.2002 Wasserstand: 266 cm
- 18.06.1991 Wasserstand: 263 cm
| Datum | Mittelwert [cm] | Maximum [cm] | Minimum [cm] |
|---|---|---|---|
| 23.05.2024 | 28 | 40 | 24 |
| 22.05.2024 | 27 | 29 | 25 |
| 21.05.2024 | 26 | 29 | 23 |
| 20.05.2024 | 25 | 27 | 24 |
| 19.05.2024 | 30 | 34 | 26 |
| 18.05.2024 | 26 | 30 | 24 |
| 17.05.2024 | 29 | 34 | 23 |
© Bayerisches Landesamt für Umwelt 2024