
- Startseite >
- Flüsse >
- Wasserstand >
- Bayern >
- Ettleben >
- Jahresgrafik

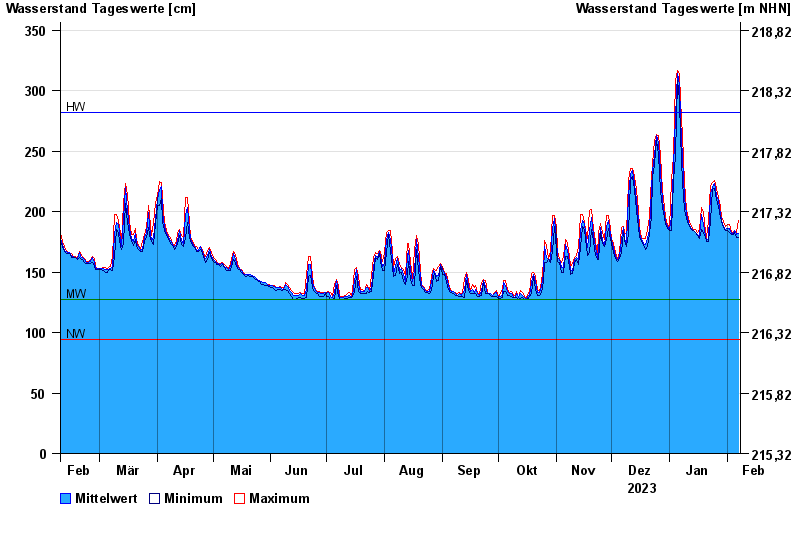
Jahresgrafik Ettleben / Wern
Wasserstand vom 08.02.2023 bis zum 07.02.2024
| Datum | Mittelwert [cm] | Maximum [cm] | Minimum [cm] |
|---|---|---|---|
| 07.02.2024 | 182 | 193 | 179 |
| 06.02.2024 | 181 | 183 | 179 |
| 05.02.2024 | 184 | 184 | 183 |
| 04.02.2024 | 182 | 183 | 181 |
| 03.02.2024 | 182 | 183 | 181 |
| 02.02.2024 | 186 | 189 | 183 |
| 01.02.2024 | 186 | 189 | 184 |
© Bayerisches Landesamt für Umwelt 2024