
- Startseite >
- Flüsse >
- Wasserstand >
- Bayern >
- Eßlingen >
- Jahresgrafik

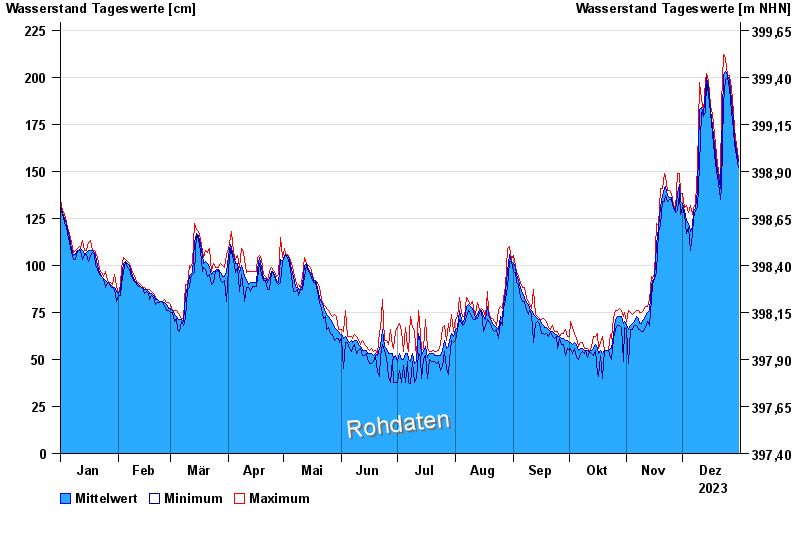
Jahresgrafik Eßlingen / Altmühl
Wasserstand vom 01.01.2023 bis zum 31.12.2023
- 14.01.2019 Wasserstand: 226 cm
- 13.03.2020 Wasserstand: 193 cm
- 24.12.2018 Wasserstand: 192 cm
- 04.02.2021 Wasserstand: 188 cm
- 05.01.2022 Wasserstand: 169 cm
| Datum | Mittelwert [cm] | Maximum [cm] | Minimum [cm] |
|---|---|---|---|
| 31.12.2023 | 155 | 157 | 152 |
| 30.12.2023 | 161 | 164 | 158 |
| 29.12.2023 | 168 | 172 | 164 |
| 28.12.2023 | 177 | 182 | 172 |
| 27.12.2023 | 188 | 194 | 182 |
| 26.12.2023 | 198 | 201 | 194 |
| 25.12.2023 | 201 | 201 | 200 |
© Bayerisches Landesamt für Umwelt 2025