
- Startseite >
- Flüsse >
- Wasserstand >
- Bayern >
- Eschach >
- Jahresgrafik

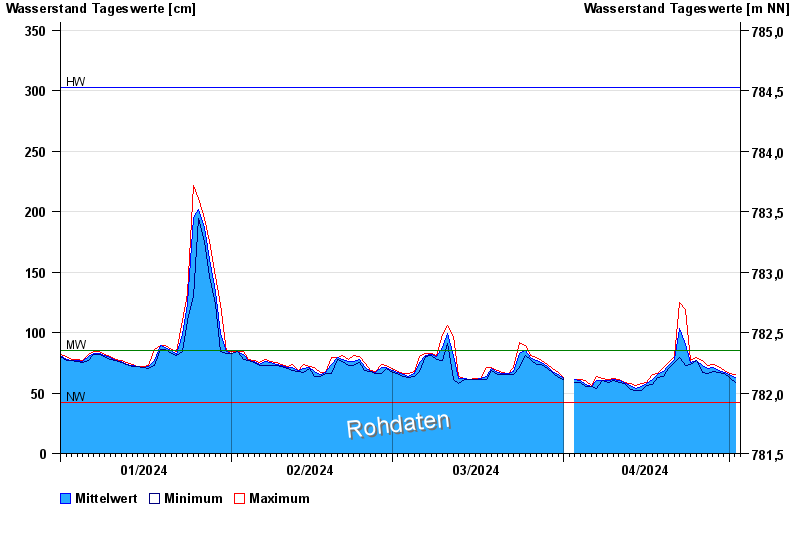
Jahresgrafik Eschach / Füssener Achen
Wasserstand vom 01.01.2024 bis zum 02.05.2024
| Datum | Mittelwert [cm] | Maximum [cm] | Minimum [cm] |
|---|---|---|---|
| 02.05.2024 | 64 | 64 | 63 |
| 01.05.2024 | 65 | 66 | 63 |
| 30.04.2024 | 67 | 69 | 66 |
| 29.04.2024 | 69 | 72 | 67 |
| 28.04.2024 | 71 | 74 | 68 |
| 27.04.2024 | 70 | 73 | 66 |
| 26.04.2024 | 73 | 77 | 67 |
© Bayerisches Landesamt für Umwelt 2024