
- Startseite >
- Flüsse >
- Wasserstand >
- Bayern >
- Eschach >
- Jahresgrafik

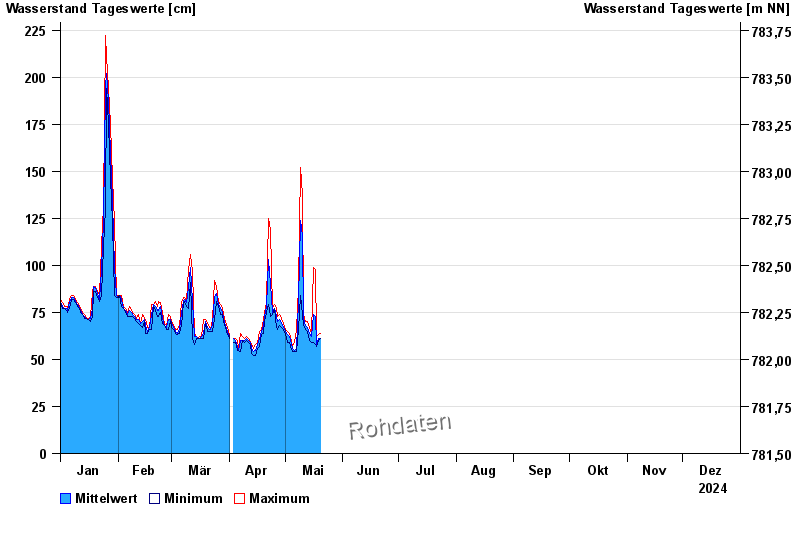
Jahresgrafik Eschach / Füssener Achen
Wasserstand vom 01.01.2024 bis zum 31.12.2024
 Für diesen Pegel sind keine Hochwassermarken hinterlegt.
| Datum | Mittelwert [cm] | Maximum [cm] | Minimum [cm] |
|---|---|---|---|
| 06.06.2024 | 192 | 200 | 183 |
| 05.06.2024 | 214 | 227 | 201 |
| 04.06.2024 | 236 | 243 | 227 |
| 03.06.2024 | 231 | 244 | 200 |
| 02.06.2024 | 211 | 222 | 201 |
| 01.06.2024 | 215 | 224 | 205 |
| 31.05.2024 | 160 | 204 | 123 |
© Bayerisches Landesamt für Umwelt 2024