
- Startseite >
- Flüsse >
- Wasserstand >
- Bayern >
- Eching >
- Jahresgrafik

Jahresgrafik Eching / Windach
Wasserstand vom 06.07.2023 bis zum 05.07.2024
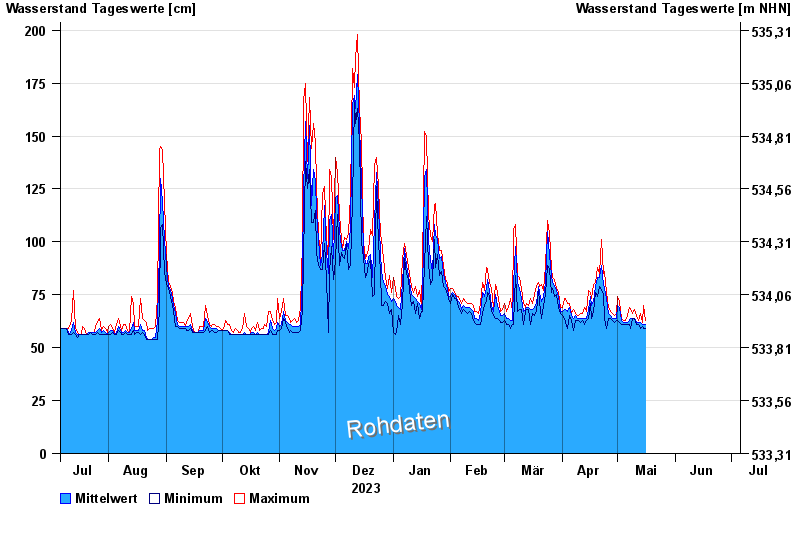
Hinweis
Pegel beeinflusst durch Kraftwerkssteuerung
| Datum | Mittelwert [cm] | Maximum [cm] | Minimum [cm] |
|---|---|---|---|
| 01.06.2024 | 191 | 217 | 167 |
| 31.05.2024 | 110 | 167 | 80 |
| 30.05.2024 | 81 | 86 | 78 |
| 29.05.2024 | 80 | 83 | 77 |
| 28.05.2024 | 72 | 82 | 68 |
| 27.05.2024 | 80 | 89 | 68 |
| 26.05.2024 | 80 | 91 | 64 |
© Bayerisches Landesamt für Umwelt 2024