
- Startseite >
- Flüsse >
- Wasserstand >
- Bayern >
- Eching >
- Jahresgrafik

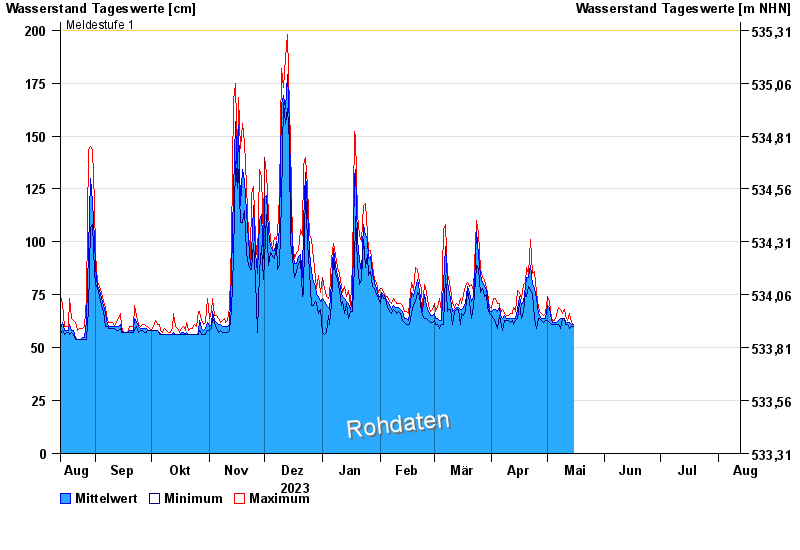
Jahresgrafik Eching / Windach
Wasserstand vom 13.08.2023 bis zum 12.08.2024
Hinweis
Pegel beeinflusst durch Kraftwerkssteuerung
- Meldestufe 1 200 cm
- Meldestufe 3 240 cm
| Datum | Mittelwert [cm] | Maximum [cm] | Minimum [cm] |
|---|---|---|---|
| 29.04.2024 | 64 | 64 | 64 |
| 28.04.2024 | 64 | 66 | 63 |
| 27.04.2024 | 65 | 67 | 64 |
| 26.04.2024 | 66 | 69 | 64 |
| 25.04.2024 | 73 | 76 | 59 |
| 24.04.2024 | 78 | 86 | 64 |
| 23.04.2024 | 80 | 85 | 75 |
© Bayerisches Landesamt für Umwelt 2024