
- Startseite >
- Flüsse >
- Wasserstand >
- Bayern >
- Eching >
- Jahresgrafik

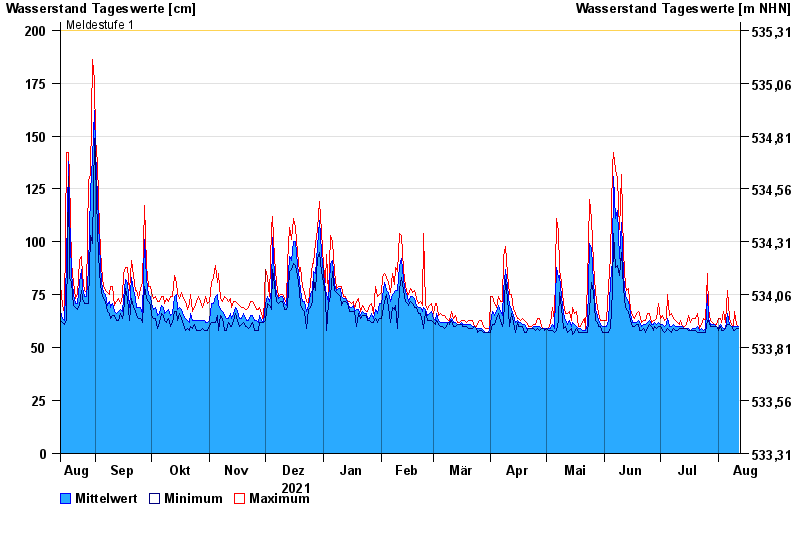
Jahresgrafik Eching / Windach
Wasserstand vom 13.08.2021 bis zum 12.08.2022
Hinweis
Pegel beeinflusst durch Kraftwerkssteuerung
- Meldestufe 1 200 cm
- Meldestufe 3 240 cm
| Datum | Mittelwert [cm] | Maximum [cm] | Minimum [cm] |
|---|---|---|---|
| 12.08.2022 | 60 | 60 | 59 |
| 11.08.2022 | 60 | 61 | 59 |
| 10.08.2022 | 60 | 67 | 58 |
| 09.08.2022 | 60 | 60 | 58 |
| 08.08.2022 | 60 | 61 | 60 |
| 07.08.2022 | 61 | 64 | 61 |
| 06.08.2022 | 66 | 77 | 61 |
© Bayerisches Landesamt für Umwelt 2024