
- Startseite >
- Flüsse >
- Wasserstand >
- Bayern >
- Eberhardsreuth >
- Jahresgrafik

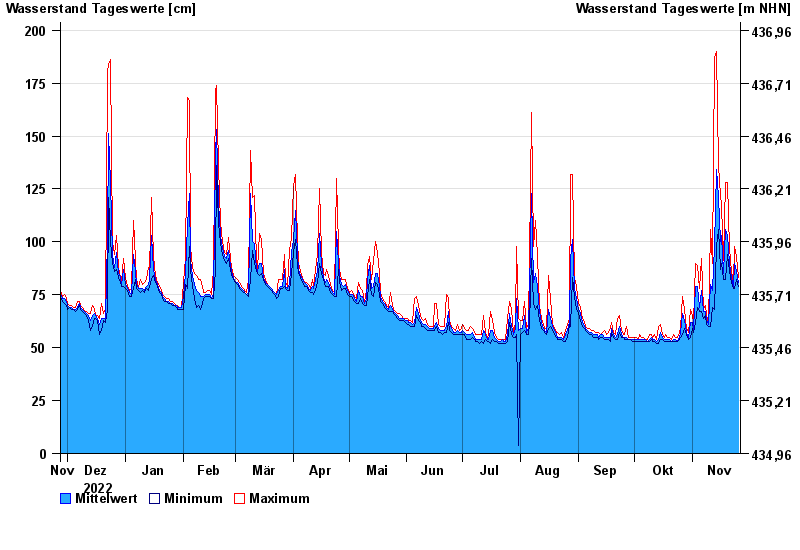
Jahresgrafik Eberhardsreuth / Mitternacher Ohe
Wasserstand vom 27.11.2022 bis zum 26.11.2023
| Datum | Mittelwert [cm] | Maximum [cm] | Minimum [cm] |
|---|---|---|---|
| 26.11.2023 | 81 | 83 | 79 |
| 25.11.2023 | 86 | 93 | 82 |
| 24.11.2023 | 90 | 98 | 78 |
| 23.11.2023 | 79 | 81 | 78 |
| 22.11.2023 | 83 | 86 | 81 |
| 21.11.2023 | 90 | 97 | 86 |
| 20.11.2023 | 103 | 128 | 94 |
© Bayerisches Landesamt für Umwelt 2024