
- Startseite >
- Flüsse >
- Wasserstand >
- Bayern >
- Eberhardsreuth >
- Jahresgrafik

Jahresgrafik Eberhardsreuth / Mitternacher Ohe
Wasserstand vom 01.01.2024 bis zum 31.12.2024
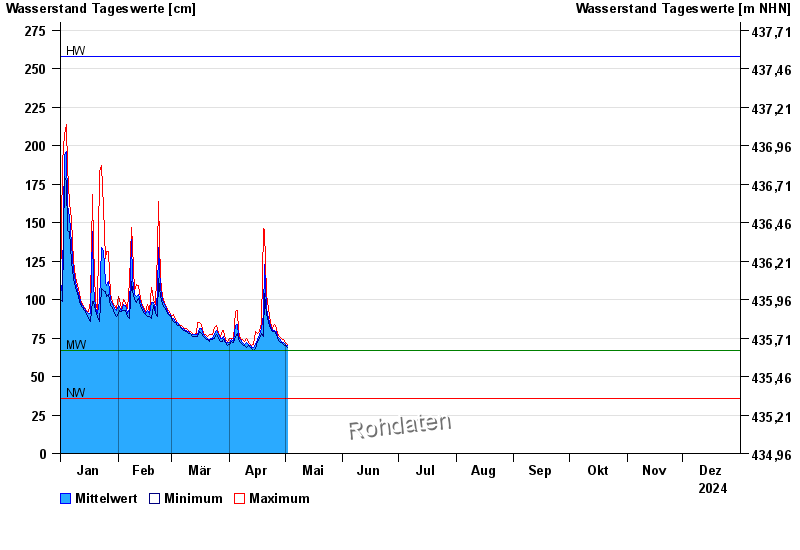
| Datum | Mittelwert [cm] | Maximum [cm] | Minimum [cm] |
|---|---|---|---|
| 02.05.2024 | 70 | 71 | 70 |
| 01.05.2024 | 71 | 72 | 70 |
| 30.04.2024 | 72 | 74 | 71 |
| 29.04.2024 | 73 | 75 | 72 |
| 28.04.2024 | 75 | 76 | 73 |
| 27.04.2024 | 76 | 78 | 75 |
| 26.04.2024 | 79 | 81 | 77 |
© Bayerisches Landesamt für Umwelt 2024