
- Startseite >
- Flüsse >
- Wasserstand >
- Bayern >
- Eberhardsreuth >
- Jahresgrafik

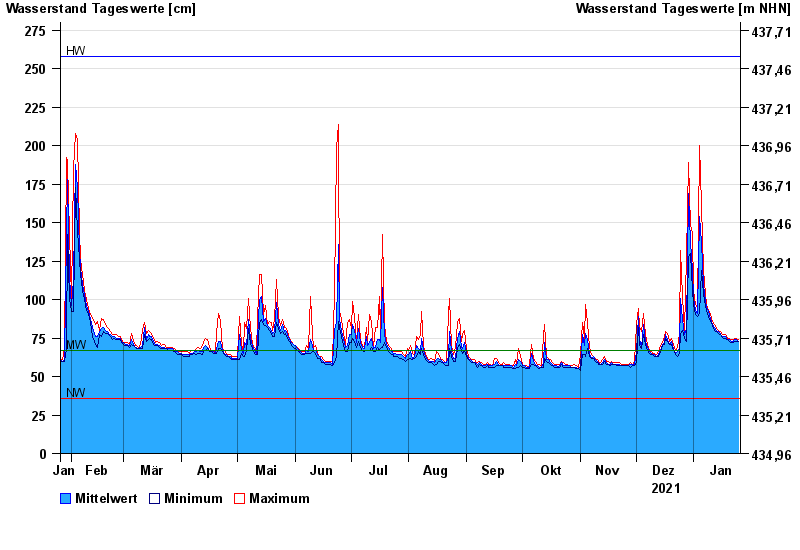
Jahresgrafik Eberhardsreuth / Mitternacher Ohe
Wasserstand vom 26.01.2021 bis zum 25.01.2022
| Datum | Mittelwert [cm] | Maximum [cm] | Minimum [cm] |
|---|---|---|---|
| 25.01.2022 | 73 | 74 | 73 |
| 24.01.2022 | 74 | 75 | 73 |
| 23.01.2022 | 74 | 75 | 73 |
| 22.01.2022 | 73 | 74 | 72 |
| 21.01.2022 | 73 | 74 | 72 |
| 20.01.2022 | 74 | 75 | 73 |
| 19.01.2022 | 74 | 75 | 74 |
© Bayerisches Landesamt für Umwelt 2024