
- Startseite >
- Flüsse >
- Wasserstand >
- Bayern >
- Dillingen >
- Jahresgrafik

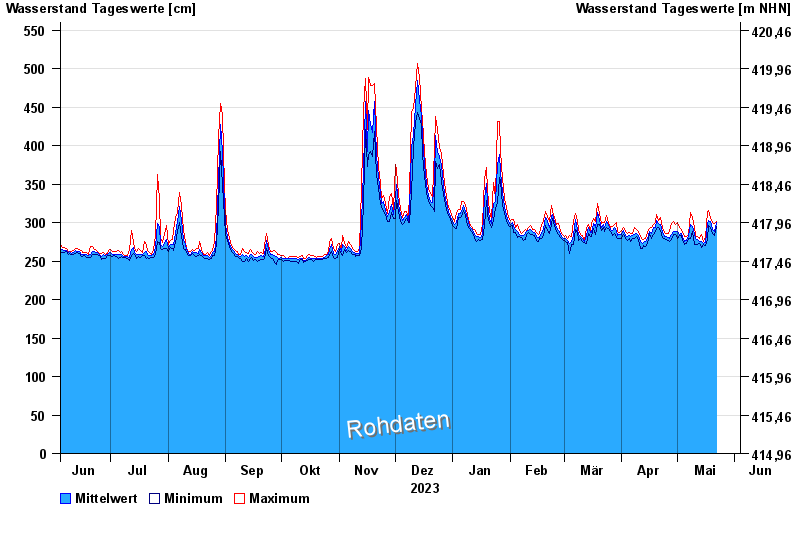
Jahresgrafik Dillingen / Donau
Wasserstand vom 04.06.2023 bis zum 03.06.2024
ACHTUNG!
Abflussermittlung bei Niedrigwasser beeinflusst.
- 24.05.1999 Wasserstand: 592 cm
- 06.02.1980 Wasserstand: 579 cm
- 13.08.2002 Wasserstand: 573 cm
- 30.09.1981 Wasserstand: 573 cm
- 24.08.2005 Wasserstand: 572 cm
| Datum | Mittelwert [cm] | Maximum [cm] | Minimum [cm] |
|---|---|---|---|
| 22.05.2024 | 300 | 302 | 295 |
| 21.05.2024 | 289 | 299 | 283 |
| 20.05.2024 | 291 | 300 | 286 |
| 19.05.2024 | 301 | 307 | 294 |
| 18.05.2024 | 303 | 316 | 296 |
| 17.05.2024 | 299 | 315 | 278 |
| 16.05.2024 | 274 | 281 | 270 |
© Bayerisches Landesamt für Umwelt 2024