
- Startseite >
- Flüsse >
- Wasserstand >
- Bayern >
- Dillingen >
- Jahresgrafik

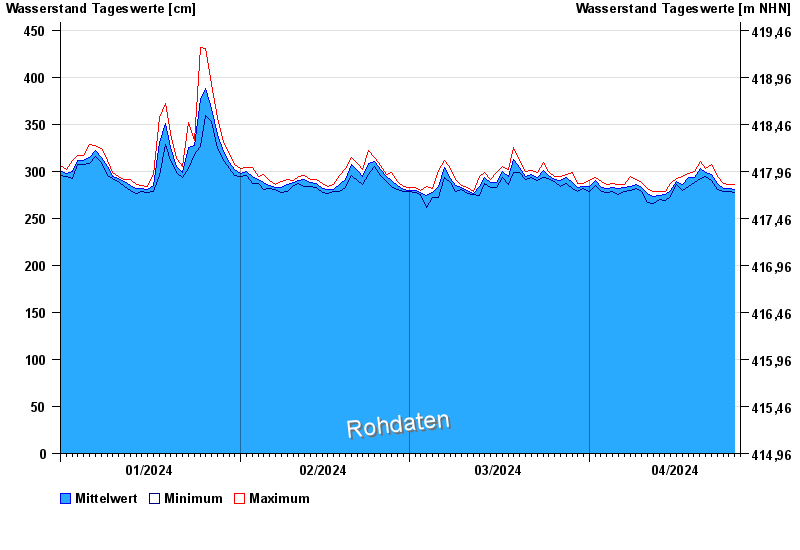
Jahresgrafik Dillingen / Donau
Wasserstand vom 01.01.2024 bis zum 26.04.2024
ACHTUNG!
Abflussermittlung bei Niedrigwasser beeinflusst.
- 24.05.1999 Wasserstand: 592 cm
- 06.02.1980 Wasserstand: 579 cm
- 13.08.2002 Wasserstand: 573 cm
- 30.09.1981 Wasserstand: 573 cm
- 24.08.2005 Wasserstand: 572 cm
| Datum | Mittelwert [cm] | Maximum [cm] | Minimum [cm] |
|---|---|---|---|
| 26.04.2024 | 280 | 284 | 278 |
| 25.04.2024 | 282 | 286 | 278 |
| 24.04.2024 | 282 | 287 | 279 |
| 23.04.2024 | 287 | 294 | 281 |
| 22.04.2024 | 297 | 307 | 290 |
| 21.04.2024 | 299 | 303 | 294 |
| 20.04.2024 | 303 | 310 | 292 |
© Bayerisches Landesamt für Umwelt 2024