
- Startseite >
- Flüsse >
- Wasserstand >
- Bayern >
- Deuerling >
- Jahresgrafik

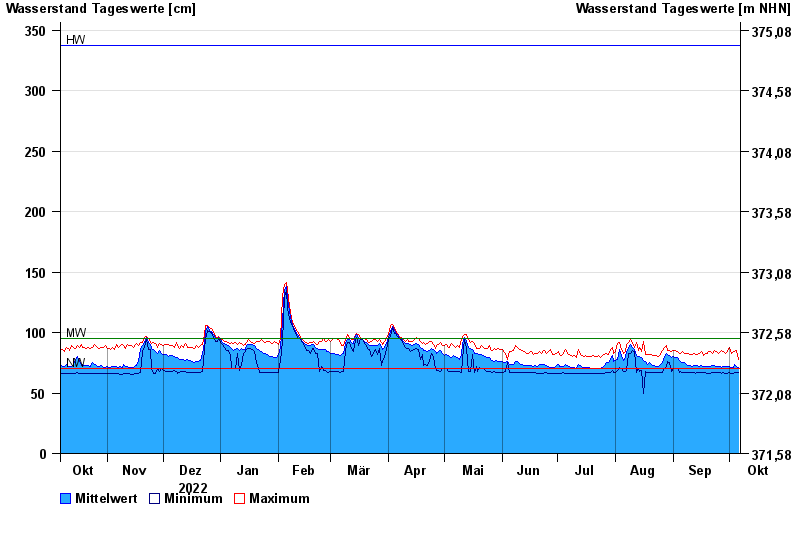
Jahresgrafik Deuerling / Schwarze Laber
Wasserstand vom 07.10.2022 bis zum 06.10.2023
| Datum | Mittelwert [cm] | Maximum [cm] | Minimum [cm] |
|---|---|---|---|
| 06.10.2023 | 71 | 78 | 67 |
| 05.10.2023 | 72 | 85 | 67 |
| 04.10.2023 | 74 | 84 | 67 |
| 03.10.2023 | 71 | 84 | 66 |
| 02.10.2023 | 71 | 83 | 66 |
| 01.10.2023 | 72 | 88 | 67 |
| 30.09.2023 | 72 | 84 | 66 |
© Bayerisches Landesamt für Umwelt 2024