
- Startseite >
- Flüsse >
- Wasserstand >
- Bayern >
- Buchloe >
- Jahresgrafik

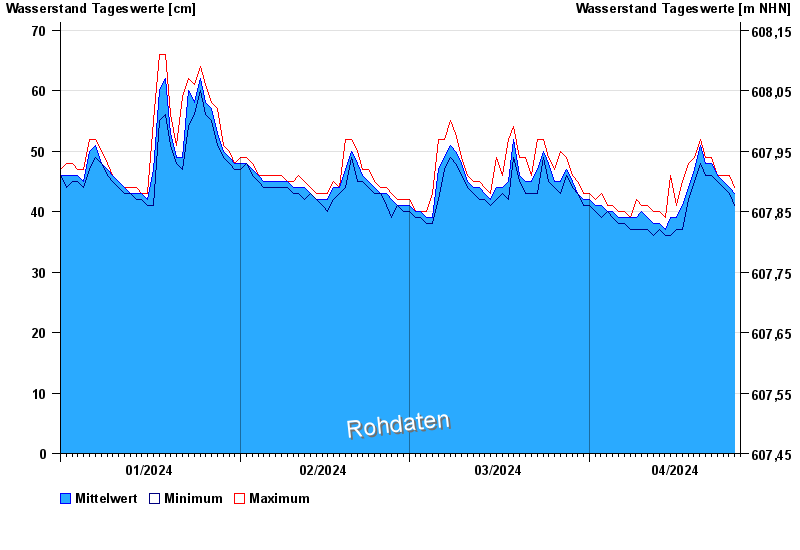
Jahresgrafik Buchloe / Gennach
Wasserstand vom 01.01.2024 bis zum 26.04.2024
 Für diesen Pegel sind keine Hochwassermarken hinterlegt.
| Datum | Mittelwert [cm] | Maximum [cm] | Minimum [cm] |
|---|---|---|---|
| 26.04.2024 | 43 | 44 | 42 |
| 25.04.2024 | 44 | 46 | 43 |
| 24.04.2024 | 45 | 46 | 44 |
| 23.04.2024 | 46 | 46 | 45 |
| 22.04.2024 | 48 | 49 | 46 |
| 21.04.2024 | 48 | 49 | 46 |
| 20.04.2024 | 51 | 52 | 48 |
© Bayerisches Landesamt für Umwelt 2024