
- Startseite >
- Flüsse >
- Wasserstand >
- Bayern >
- Böhmischbruck >
- Jahresgrafik

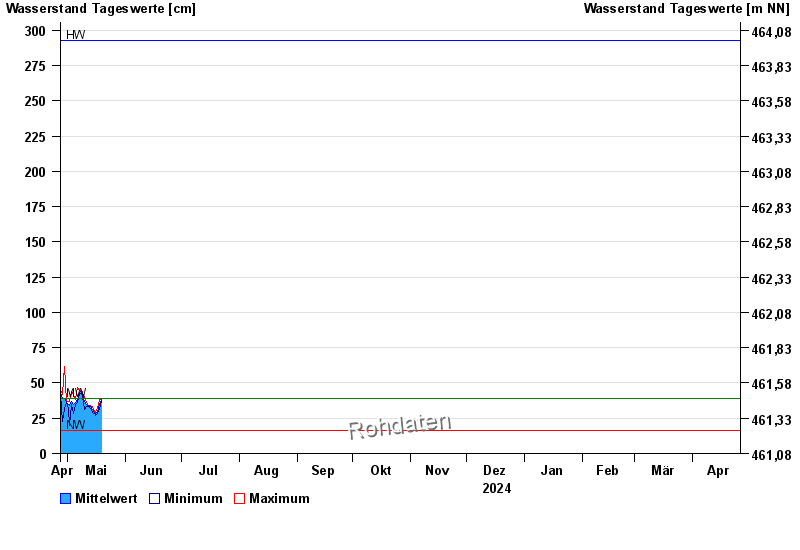
Jahresgrafik Böhmischbruck / Pfreimd
Wasserstand vom 27.04.2024 bis zum 26.04.2025
| Datum | Mittelwert [cm] | Maximum [cm] | Minimum [cm] |
|---|---|---|---|
| 27.05.2024 | 47 | 57 | 37 |
| 26.05.2024 | 55 | 60 | 51 |
| 25.05.2024 | 62 | 66 | 58 |
| 24.05.2024 | 72 | 78 | 66 |
| 23.05.2024 | 77 | 91 | 71 |
| 22.05.2024 | 70 | 105 | 39 |
| 21.05.2024 | 34 | 39 | 29 |
© Bayerisches Landesamt für Umwelt 2024