
- Startseite >
- Flüsse >
- Wasserstand >
- Bayern >
- Bockenfeld >
- Jahresgrafik

Jahresgrafik Bockenfeld / Tauber
Wasserstand vom 27.04.2024 bis zum 26.04.2025
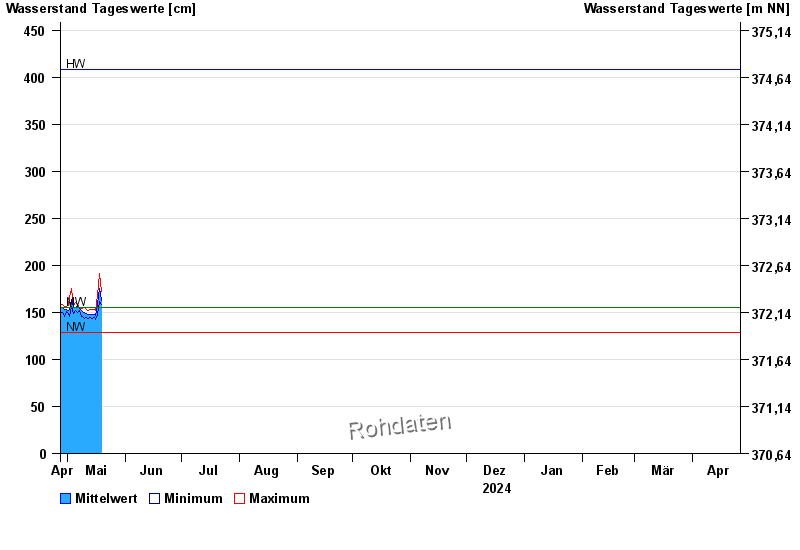
Hinweis
Wasserstand und Abfluss wird zeitweise durch Biberdamm beeinflusst.
| Datum | Mittelwert [cm] | Maximum [cm] | Minimum [cm] |
|---|---|---|---|
| 07.05.2024 | 154 | 155 | 154 |
| 06.05.2024 | 156 | 158 | 150 |
| 05.05.2024 | 155 | 160 | 152 |
| 04.05.2024 | 155 | 156 | 149 |
| 03.05.2024 | 164 | 175 | 156 |
| 02.05.2024 | 153 | 166 | 146 |
| 01.05.2024 | 152 | 157 | 149 |
© Bayerisches Landesamt für Umwelt 2024