
- Startseite >
- Flüsse >
- Wasserstand >
- Bayern >
- Bad Aibling >
- Jahresgrafik

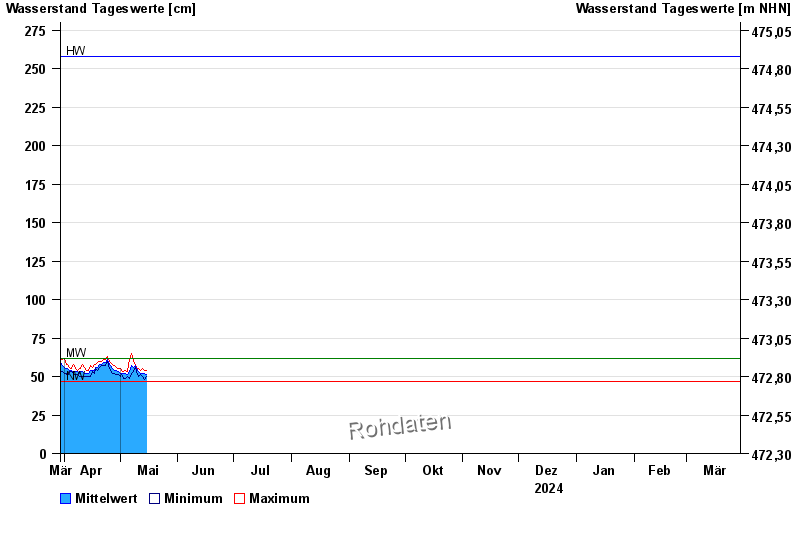
Jahresgrafik Bad Aibling / Glonn
Wasserstand vom 30.03.2024 bis zum 29.03.2025
| Datum | Mittelwert [cm] | Maximum [cm] | Minimum [cm] |
|---|---|---|---|
| 31.05.2024 | 94 | 110 | 88 |
| 30.05.2024 | 72 | 87 | 64 |
| 29.05.2024 | 72 | 82 | 65 |
| 28.05.2024 | 83 | 96 | 58 |
| 27.05.2024 | 58 | 61 | 56 |
| 26.05.2024 | 60 | 63 | 56 |
| 25.05.2024 | 67 | 72 | 63 |
© Bayerisches Landesamt für Umwelt 2024