
- Startseite >
- Flüsse >
- Wasserstand >
- Bayern >
- Au b. Bad Aibling >
- Jahresgrafik

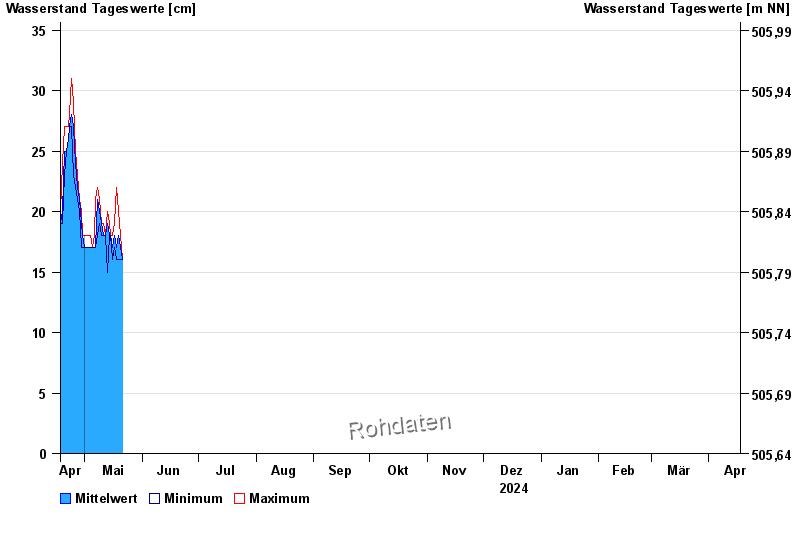
Jahresgrafik Au b. Bad Aibling / Aubach
Wasserstand vom 18.04.2024 bis zum 17.04.2025
 Für diesen Pegel sind keine Hochwassermarken hinterlegt.
| Datum | Mittelwert [cm] | Maximum [cm] | Minimum [cm] |
|---|---|---|---|
| 21.05.2024 | 16 | 16 | 16 |
| 20.05.2024 | 17 | 18 | 16 |
| 19.05.2024 | 18 | 20 | 16 |
| 18.05.2024 | 17 | 22 | 16 |
| 17.05.2024 | 18 | 19 | 17 |
| 16.05.2024 | 17 | 18 | 16 |
| 15.05.2024 | 18 | 18 | 18 |
© Bayerisches Landesamt für Umwelt 2024