
- Startseite >
- Flüsse >
- Schwebstoff >
- Untere Donau >
- Staudach >
- Jahresgrafik

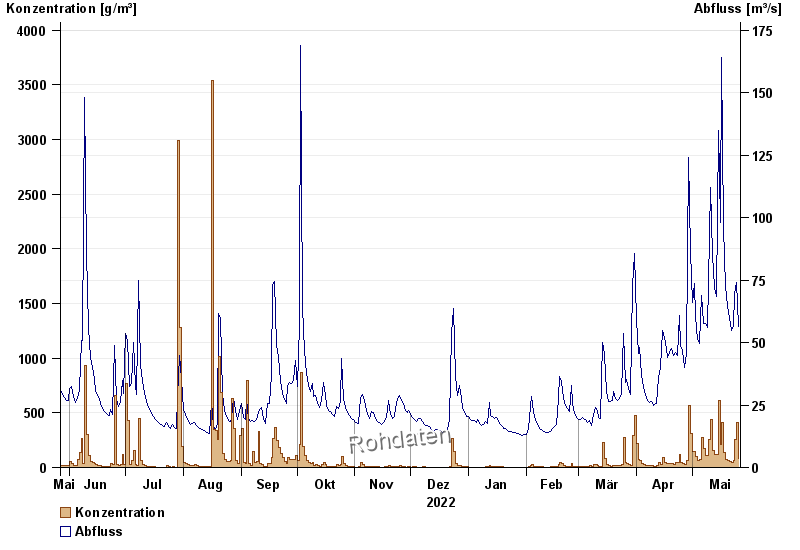
Jahresgrafik Staudach / Tiroler Achen
Schwebstoff vom 27.05.2022 bis zum 26.05.2023
| Datum | Konzentration [g/m³] | Abfluss [m³/s] |
|---|---|---|
| 26.05.2023 | 85,0 | 56,3 |
| 25.05.2023 | 409,2 | 74,1 |
| 24.05.2023 | 259,4 | 69,2 |
| 23.05.2023 | 66,9 | 56,7 |
| 22.05.2023 | 49,2 | 55 |
| 21.05.2023 | 57,7 | 59,5 |
| 20.05.2023 | 63,1 | 64,3 |
© Bayerisches Landesamt für Umwelt 2024