
- Startseite >
- Flüsse >
- Schwebstoff >
- Untere Donau >
- Staudach >
- Jahresgrafik

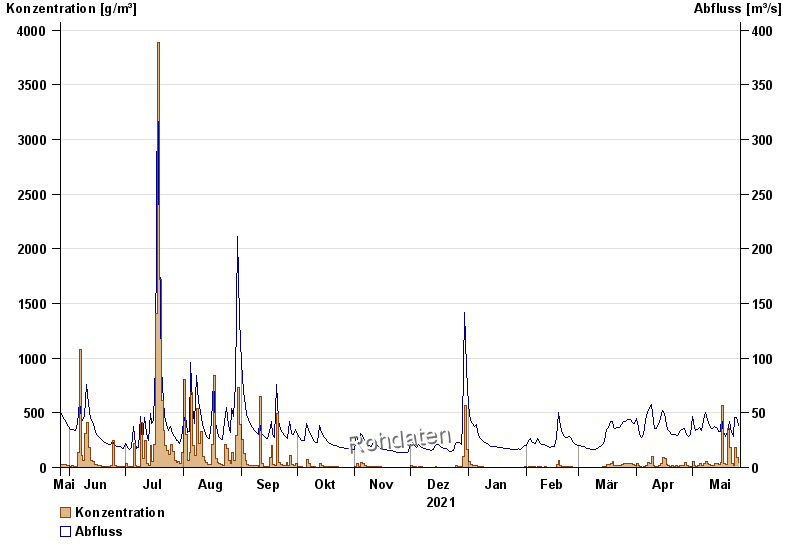
Jahresgrafik Staudach / Tiroler Achen
Schwebstoff vom 27.05.2021 bis zum 26.05.2022
| Datum | Konzentration [g/m³] | Abfluss [m³/s] |
|---|---|---|
| 26.05.2022 | 44,2 | 38 |
| 25.05.2022 | 91,8 | 45,8 |
| 24.05.2022 | 185,9 | 45,3 |
| 23.05.2022 | 16,4 | 28,4 |
| 22.05.2022 | 33,2 | 31,9 |
| 21.05.2022 | 187,3 | 42,1 |
| 20.05.2022 | 357,6 | 32,4 |
© Bayerisches Landesamt für Umwelt 2024