
- Startseite >
- Flüsse >
- Schwebstoff >
- Untere Donau >
- Kempten >
- Jahresgrafik

Jahresgrafik Kempten / Iller
Schwebstoff vom 01.01.2024 bis zum 31.12.2024
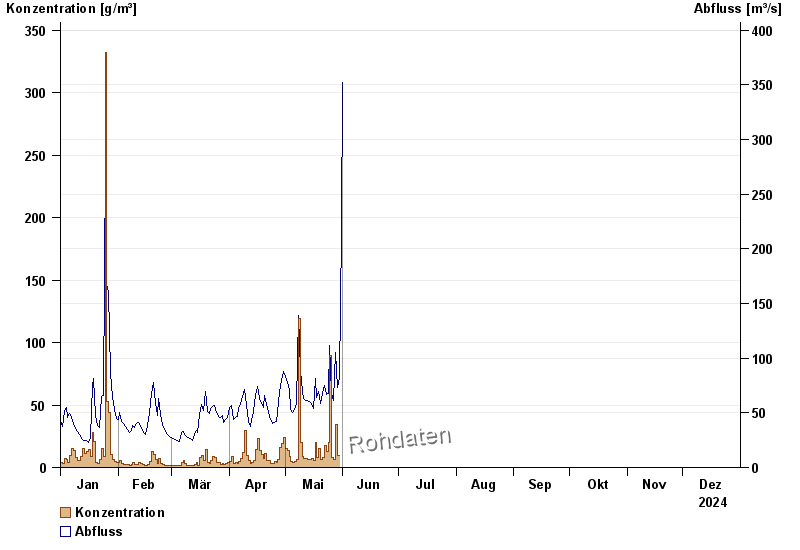
| Datum | Konzentration [g/m³] | Abfluss [m³/s] |
|---|---|---|
| 13.05.2024 | 6,6 | 61,2 |
| 12.05.2024 | 6,9 | 60,9 |
| 11.05.2024 | 7,2 | 63,4 |
| 10.05.2024 | 9,2 | 69,1 |
| 09.05.2024 | 19,8 | 89,2 |
| 08.05.2024 | 119,2 | 139 |
| 07.05.2024 | 6,6 | 58,8 |
© Bayerisches Landesamt für Umwelt 2024