
- Startseite >
- Flüsse >
- Schwebstoff >
- Naab - Regen >
- Rosenheim o.d. Mangfallmündung >
- Jahresgrafik

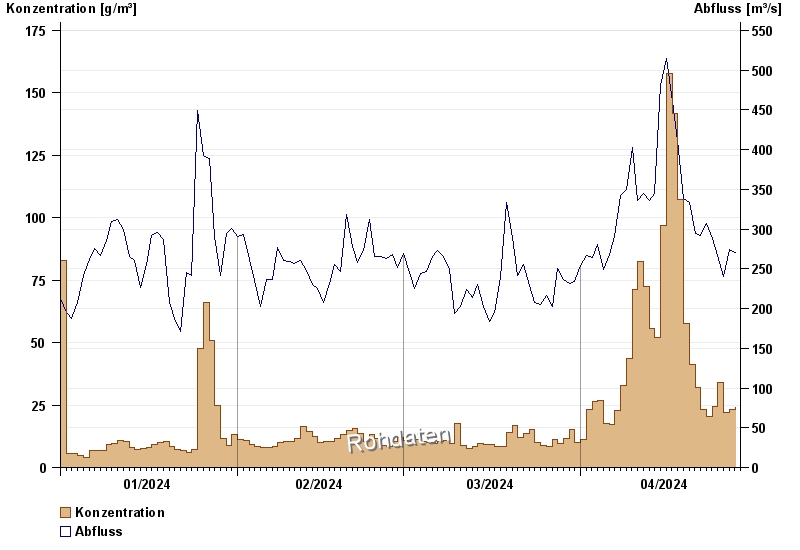
Jahresgrafik Rosenheim o.d. Mangfallmündung / Inn
Schwebstoff vom 01.01.2024 bis zum 28.04.2024
| Datum | Konzentration [g/m³] | Abfluss [m³/s] |
|---|---|---|
| 28.04.2024 | 23,9 | 271 |
| 27.04.2024 | 23,3 | 274 |
| 26.04.2024 | 22,2 | 240 |
| 25.04.2024 | 34,1 | 267 |
| 24.04.2024 | 24,3 | 288 |
| 23.04.2024 | 20,3 | 307 |
| 22.04.2024 | 23,4 | 292 |
© Bayerisches Landesamt für Umwelt 2024