
- Startseite >
- Flüsse >
- Schwebstoff >
- Naab - Regen >
- Plattling >
- Jahresgrafik

Jahresgrafik Plattling / Isar
Schwebstoff vom 30.05.2019 bis zum 29.05.2020
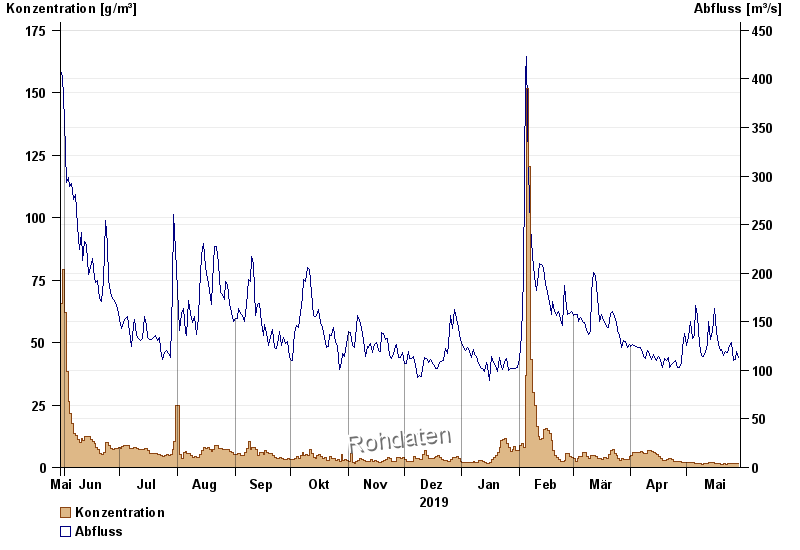
| Datum | Konzentration [g/m³] | Abfluss [m³/s] |
|---|---|---|
| 29.05.2020 | 1,4 | 113 |
| 28.05.2020 | 1,4 | 119 |
| 27.05.2020 | 1,5 | 111 |
| 26.05.2020 | 1,6 | 110 |
| 25.05.2020 | 1,6 | 129 |
| 24.05.2020 | 1,6 | 126 |
| 23.05.2020 | 1,4 | 118 |
© Bayerisches Landesamt für Umwelt 2024