
- Startseite >
- Flüsse >
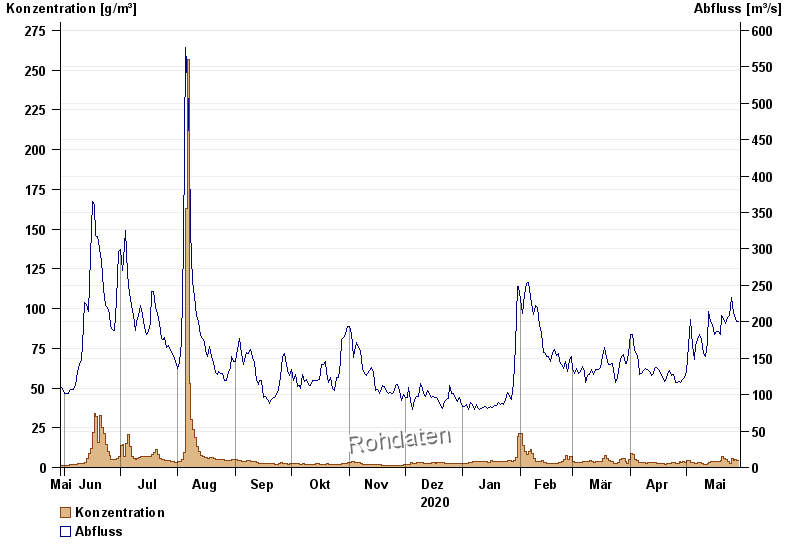
- Schwebstoff >
- Naab - Regen >
- Plattling >
- Jahresgrafik

Jahresgrafik Plattling / Isar
Schwebstoff vom 30.05.2020 bis zum 29.05.2021
| Datum | Konzentration [g/m³] | Abfluss [m³/s] |
|---|---|---|
| 29.05.2021 | 4,6 | 201 |
| 28.05.2021 | 4,4 | 201 |
| 27.05.2021 | 4,8 | 209 |
| 26.05.2021 | 4,6 | 211 |
| 25.05.2021 | 5,9 | 233 |
| 24.05.2021 | 2,7 | 208 |
| 23.05.2021 | 4,1 | 206 |
© Bayerisches Landesamt für Umwelt 2024