
- Startseite >
- Flüsse >
- Schwebstoff >
- Unterer Main >
- Ingolstadt Luitpoldstraße >
- Jahresgrafik

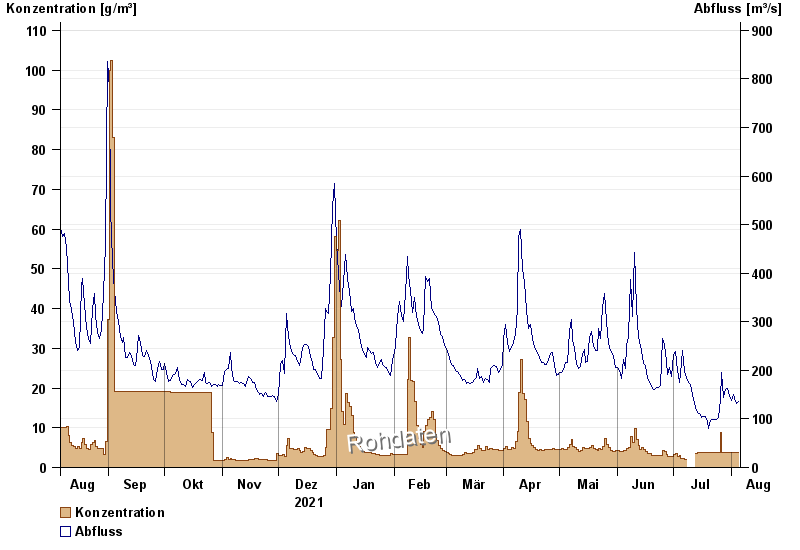
Jahresgrafik Ingolstadt Luitpoldstraße / Donau
Schwebstoff vom 06.08.2021 bis zum 05.08.2022
| Datum | Konzentration [g/m³] | Abfluss [m³/s] |
|---|---|---|
| 05.08.2022 | 3,8 | 135 |
| 04.08.2022 | 3,7 | 131 |
| 03.08.2022 | 3,8 | 143 |
| 02.08.2022 | 3,8 | 151 |
| 01.08.2022 | 3,8 | 138 |
| 31.07.2022 | 3,8 | 146 |
| 30.07.2022 | 3,8 | 162 |
© Bayerisches Landesamt für Umwelt 2024