
- Startseite >
- Flüsse >
- Schwebstoff >
- Unterer Main >
- Ingolstadt Luitpoldstraße >
- Jahresgrafik

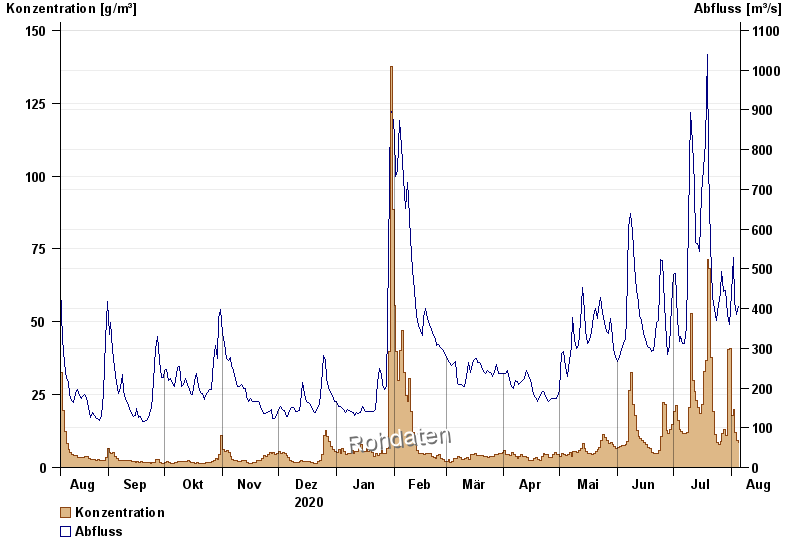
Jahresgrafik Ingolstadt Luitpoldstraße / Donau
Schwebstoff vom 06.08.2020 bis zum 05.08.2021
| Datum | Konzentration [g/m³] | Abfluss [m³/s] |
|---|---|---|
| 05.08.2021 | 8,6 | 406 |
| 04.08.2021 | 9,2 | 385 |
| 03.08.2021 | 12,1 | 417 |
| 02.08.2021 | 19,8 | 528 |
| 01.08.2021 | 17,8 | 439 |
| 31.07.2021 | 40,9 | 359 |
| 30.07.2021 | 40,4 | 386 |
© Bayerisches Landesamt für Umwelt 2024