
- Startseite >
- Flüsse >
- Schwebstoff >
- Unterer Main >
- Donauwörth >
- Jahresgrafik

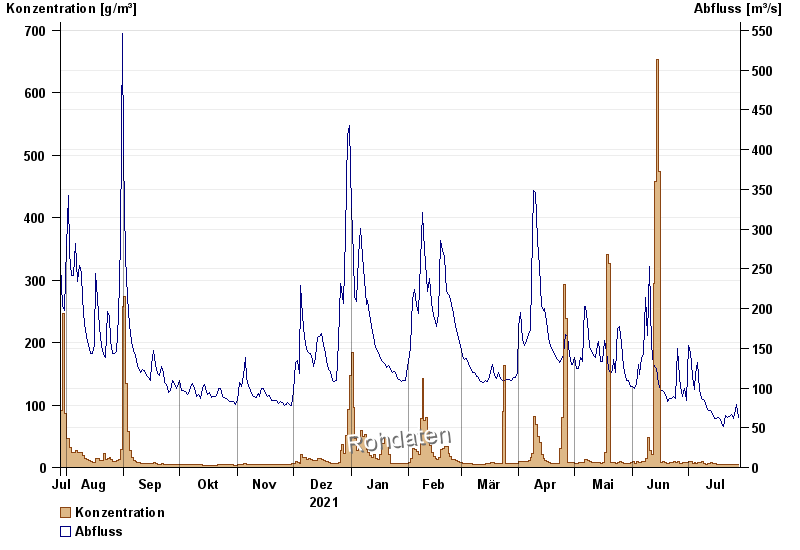
Jahresgrafik Donauwörth / Donau
Schwebstoff vom 29.07.2021 bis zum 28.07.2022
| Datum | Konzentration [g/m³] | Abfluss [m³/s] |
|---|---|---|
| 28.07.2022 | 4,8 | 62,8 |
| 27.07.2022 | 5,3 | 79,3 |
| 26.07.2022 | 4,8 | 66,5 |
| 25.07.2022 | 4,4 | 61,7 |
| 24.07.2022 | 5,4 | 67 |
| 23.07.2022 | 4,6 | 63,9 |
| 22.07.2022 | 5,0 | 62,3 |
© Bayerisches Landesamt für Umwelt 2024