
- Startseite >
- Flüsse >
- Schwebstoff >
- Unterer Main >
- Donauwörth >
- Jahresgrafik

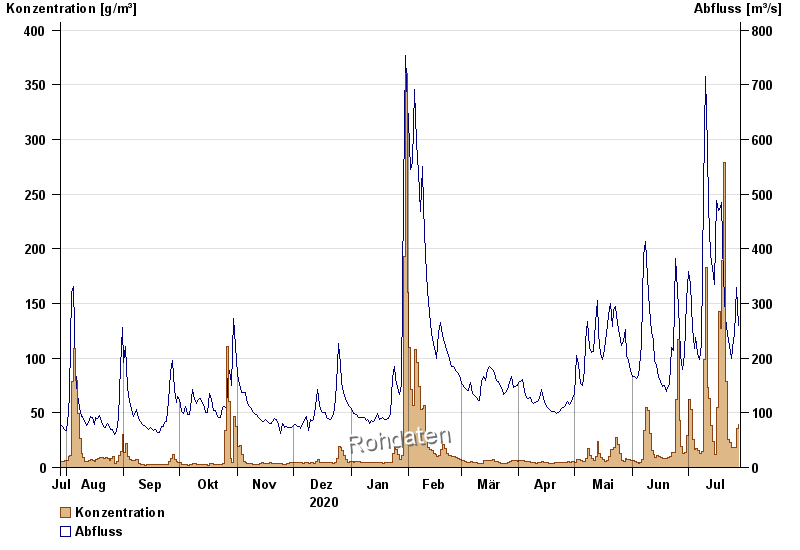
Jahresgrafik Donauwörth / Donau
Schwebstoff vom 29.07.2020 bis zum 28.07.2021
| Datum | Konzentration [g/m³] | Abfluss [m³/s] |
|---|---|---|
| 28.07.2021 | 39,3 | 260 |
| 27.07.2021 | 35,3 | 330 |
| 26.07.2021 | 18,3 | 242 |
| 25.07.2021 | 18,7 | 234 |
| 24.07.2021 | 18,5 | 200 |
| 23.07.2021 | 22,7 | 224 |
| 22.07.2021 | 25,4 | 244 |
© Bayerisches Landesamt für Umwelt 2024