
- Startseite >
- Flüsse >
- Schwebstoff >
- Obere Donau >
- Donauwörth >
- Jahresgrafik

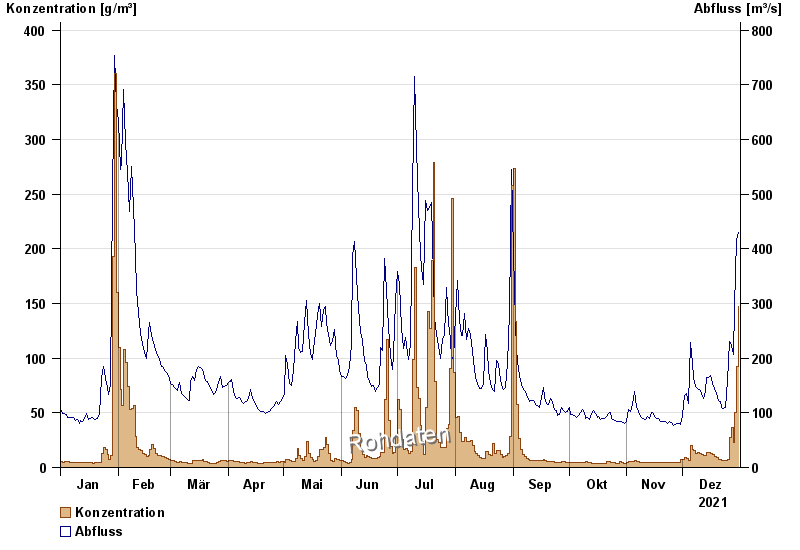
Jahresgrafik Donauwörth / Donau
Schwebstoff vom 01.01.2021 bis zum 31.12.2021
| Datum | Konzentration [g/m³] | Abfluss [m³/s] |
|---|---|---|
| 31.12.2021 | 147,1 | 430 |
| 30.12.2021 | 92,8 | 418 |
| 29.12.2021 | 50,5 | 292 |
| 28.12.2021 | 23,0 | 206 |
| 27.12.2021 | 37,0 | 224 |
| 26.12.2021 | 27,8 | 231 |
| 25.12.2021 | 7,6 | 159 |
© Bayerisches Landesamt für Umwelt 2024