
- Startseite >
- Flüsse >
- Schwebstoff >
- Isar >
- Eschelbach >
- Jahresgrafik

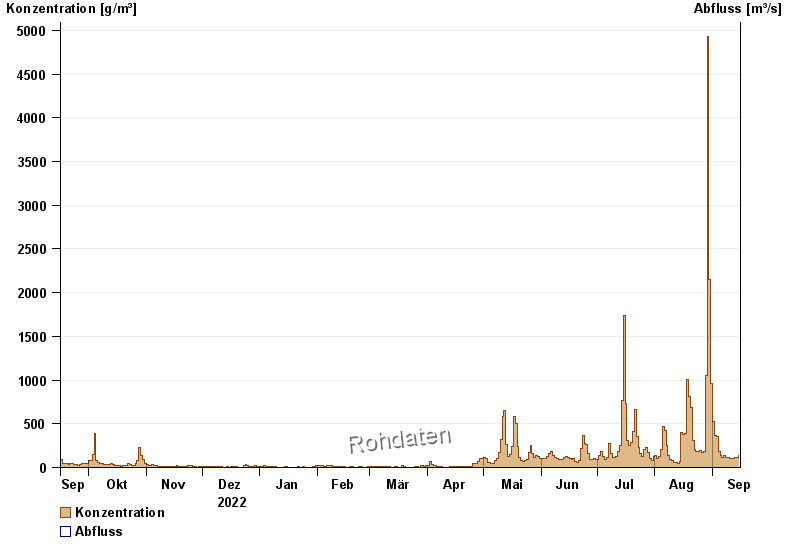
Jahresgrafik Eschelbach / Inn
Schwebstoff vom 16.09.2022 bis zum 15.09.2023
| Datum | Konzentration [g/m³] | Abfluss [m³/s] |
|---|---|---|
| 15.09.2023 | 136,0 | -- |
| 14.09.2023 | 119,2 | -- |
| 13.09.2023 | 111,9 | -- |
| 12.09.2023 | 100,5 | -- |
| 11.09.2023 | 98,5 | -- |
| 10.09.2023 | 104,8 | -- |
| 09.09.2023 | 108,7 | -- |
© Bayerisches Landesamt für Umwelt 2024