
- Startseite >
- Flüsse >
- Schwebstoff >
- Isar >
- Eschelbach >
- Jahresgrafik

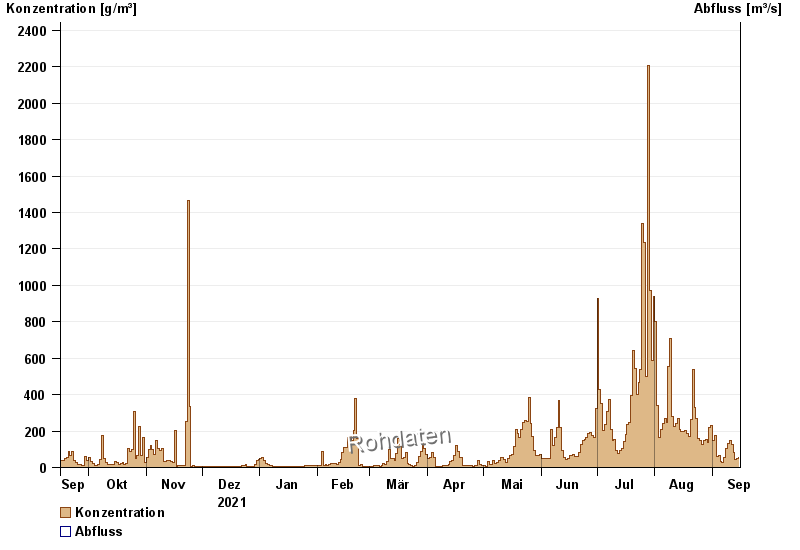
Jahresgrafik Eschelbach / Inn
Schwebstoff vom 16.09.2021 bis zum 15.09.2022
| Datum | Konzentration [g/m³] | Abfluss [m³/s] |
|---|---|---|
| 15.09.2022 | 133,0 | -- |
| 14.09.2022 | 138,5 | -- |
| 13.09.2022 | 163,0 | -- |
| 12.09.2022 | 168,9 | -- |
| 11.09.2022 | 213,8 | -- |
| 10.09.2022 | 245,4 | -- |
| 09.09.2022 | 272,8 | -- |
© Bayerisches Landesamt für Umwelt 2024